Bitcoin at $71K, Fear Still Extreme: March 15 Recap
BTC is trading at $71,431 as of March 15, 2026, up 6.3% while the Fear & Greed Index reads just 15 (Extreme Fear) and RSI sits at 57.9. Price is climbing while sentiment hasn't moved. That gap between what the market is doing and how traders feel is worth paying attention to.
Bitcoin at $71K, Fear Still Extreme: March 15, 2026 Recap
Bitcoin is up 6.3% on the week and trading at $71,431. The Fear & Greed Index reads 15. That's Extreme Fear. These two facts don't square up, and that disconnect is the most important thing to understand about this week's market.
TL;DR
- Bitcoin is trading at $71,431 as of March 15, 2026, up 6.3% over the past 7 days.
- The Fear & Greed Index reads 15 (Extreme Fear). Sentiment has not caught up to price action.
- BTC RSI(14) sits at 57.9 (Neutral) — momentum is building, and the 70 overbought level is still far off.
- BTC dominance holds at 57.0%; total crypto market cap is $2.51T.
- Bitcoin is on pace for its best week since September 2025.
Key Numbers This Week
| Metric | Value | Change |
|---|---|---|
| BTC Price | $71,431 | 🟢 +1.1% (24h), 🟢 +6.3% (7d) |
| ETH Price | $2,092 | 🟢 +0.7% (24h), 🟢 +7.6% (7d) |
| Total Market Cap | $2.51T | 🟢 +0.8% (24h) |
| BTC Dominance | 57.0% | — |
| Fear & Greed Index | 15 (Extreme Fear) | — |
| BTC RSI(14) | 57.9 (Neutral) | — |
What Drove Bitcoin's Price This Week?
BTC started the week under pressure. When the U.S.-Iran war escalated two weeks ago, bitcoin sold off hard and fast. That reaction looked bad at the time. Now, two weeks later, it's outperforming nearly everything.
The correlation between bitcoin and tech stocks has been weakening, and that showed up clearly this week. BTC climbed 6.3% while broader equity sentiment stayed choppy. That decoupling matters for signal timing. It's the kind of shift that opens up cleaner setups.
On the macro news front, analysts at CoinDesk are reviving the $1 million BTC price target. Bitwise's Matt Hougan revisited that thesis this week. The debate is about timeline, not direction.
Separately, the Ethereum Foundation sold 5,000 ETH to Tom Lee's BitMine for $10.2 million in an OTC deal. That's worth noting for ETH's 7.6% weekly gain, though the two aren't directly linked.
Why Is Fear Still at 15 When Prices Are Rising?
That 15 on the Fear & Greed Index is rough. Most retail traders are still in shock from the earlier selloff.
The gauge below shows where sentiment is sitting right now:
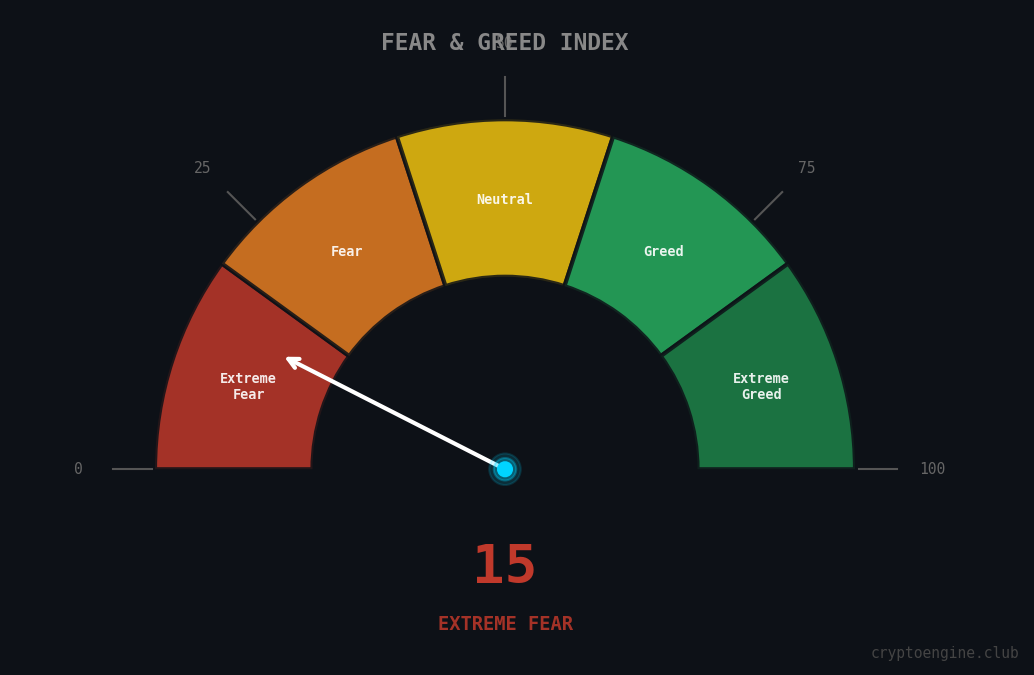
Sentiment lags price. Fear peaks after the drop, not during it. By the time the index gets to 15, most of the selling has already happened. That doesn't mean the bottom is definitively in. Nobody knows that. But historically, Extreme Fear readings alongside rising price action have been better entry setups than the inverse.
The trap is letting the fear reading stop you from acting on good setups. The number isn't telling you the market is about to fall further. It's telling you traders are still scared about what already happened.
Is BTC Overextended at $71K?
RSI at 57.9 says no.

The overbought threshold is 70. At 57.9, BTC has room to continue without triggering the exhaustion signals that typically front-run pullbacks. If you've been sitting on the sideline waiting for a clean setup, RSI gives you no reason to keep waiting based on momentum alone.
That said, one indicator isn't a trade plan. RSI at 57.9 is context, not a signal by itself.
How CryptoEngine's Signals Are Positioned
CryptoEngine's signals combine RSI with Fear & Greed and BTC dominance to build full trade plans with specific entry prices, stop-losses, and take-profit targets. This week's setup is a good example of where that combination earns its keep: RSI is neutral, sentiment is extreme, and price is moving up. Each indicator is saying something slightly different, which is exactly when having a structured signal matters more than a gut read.
With Fear & Greed still at 15, signals have been flagging setups carefully. High fear environments typically call for wider stops and more conservative targets. The historical average across 180+ tracked signals is 6.2% return over five days. That number doesn't come from chasing green weeks. It comes from staying consistent in conflicted markets like this one.
If you want to see how entries are structured week to week, CryptoEngine's pricing page has the full track record.
What to Watch Next Week
BTC dominance at 57.0% is worth watching. If dominance drops, capital starts rotating into alts. ETH is already showing it with +7.6% on the week at $2,092. Watch whether that outperformance continues or stalls when BTC reasserts.
The Fear & Greed Index matters too. A move from 15 toward 25-30 would signal sentiment catching up to price, which is typically when momentum extends further.
The U.S.-Iran situation is still live. Bitcoin has decoupled from the initial war shock, but any escalation or resolution could force a sharp repricing. Keep position sizing appropriate to that tail risk.
Frequently Asked Questions
What is the Fear & Greed Index reading for bitcoin this week? As of March 15, 2026, the Fear & Greed Index reads 15 (Extreme Fear). This reflects bearish retail sentiment that hasn't caught up to the week's 6.3% price gain in BTC.
What is BTC's RSI right now? BTC RSI(14) is at 57.9 as of March 15, 2026. That's the neutral zone, above the 30 oversold threshold and below the 70 overbought threshold. Momentum is building without being stretched.
Is bitcoin having a good week in March 2026? Yes. Bitcoin is up 6.3% over the past 7 days as of March 15, 2026, trading at $71,431. According to CoinDesk, this puts BTC on pace for its best week since September 2025.
What is bitcoin dominance right now? Bitcoin dominance stands at 57.0% as of March 15, 2026, meaning BTC holds 57% of the total $2.51T crypto market cap.
Why is crypto fear still high if BTC is going up? Sentiment lags price. The Fear & Greed Index at 15 reflects how traders feel after the earlier war-driven selloff, not what the market is doing right now. That divergence between rising price and extreme fear is a pattern traders watch closely for continuation setups.
Disclaimer: This article is for educational purposes only and does not constitute financial advice. Past performance does not guarantee future results. Always do your own research before making trading decisions.
Market data via CoinGecko. News sources: CoinDesk, The Block.