Bitcoin RSI: How to Use It for Entry and Exit Signals
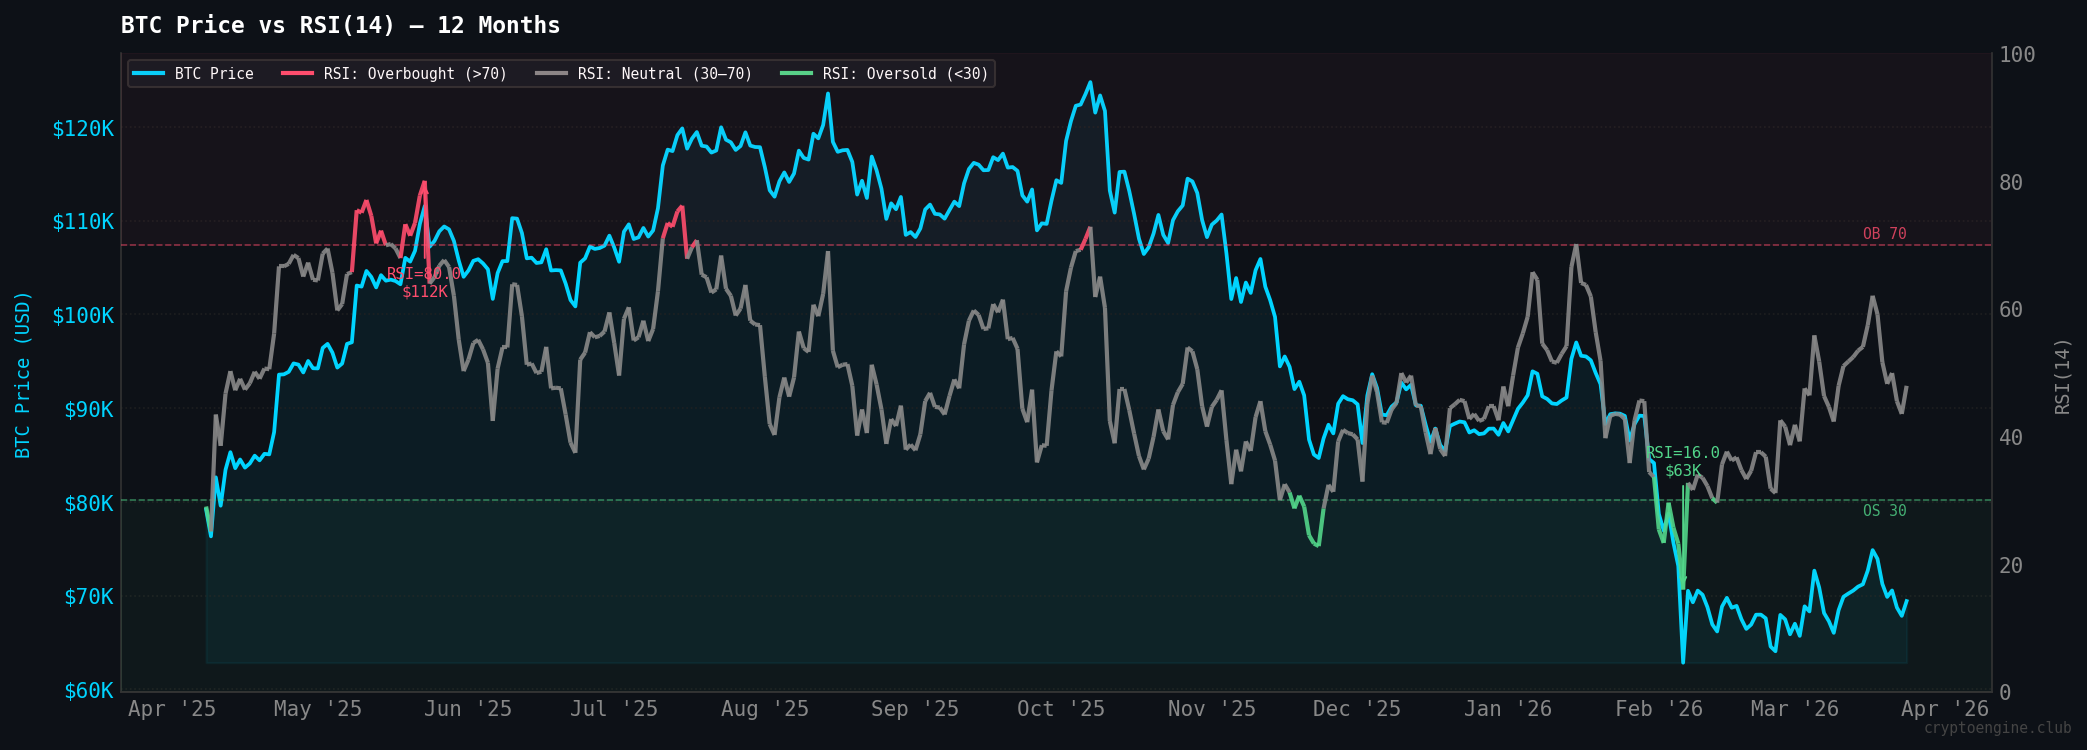
Average 30-day return after oversold: +1.9%, with 53% of readings producing a positive outcome, barely above a coin flip. RSI bottomed at 16.0 on February 6, six days before BTC hit its price cycle low. The indicator works best as a confirmation layer, not a standalone buy signal
Bitcoin RSI: How to use it for entry and exit signals
The Relative Strength Index (RSI) is a number between 0 and 100 that measures how fast and how far Bitcoin has moved in one direction. Above 70 means momentum is overextended to the upside. Below 30 means it's overextended to the downside. Most of the time it sits somewhere between those extremes and tells you the market is grinding sideways without conviction in either direction.
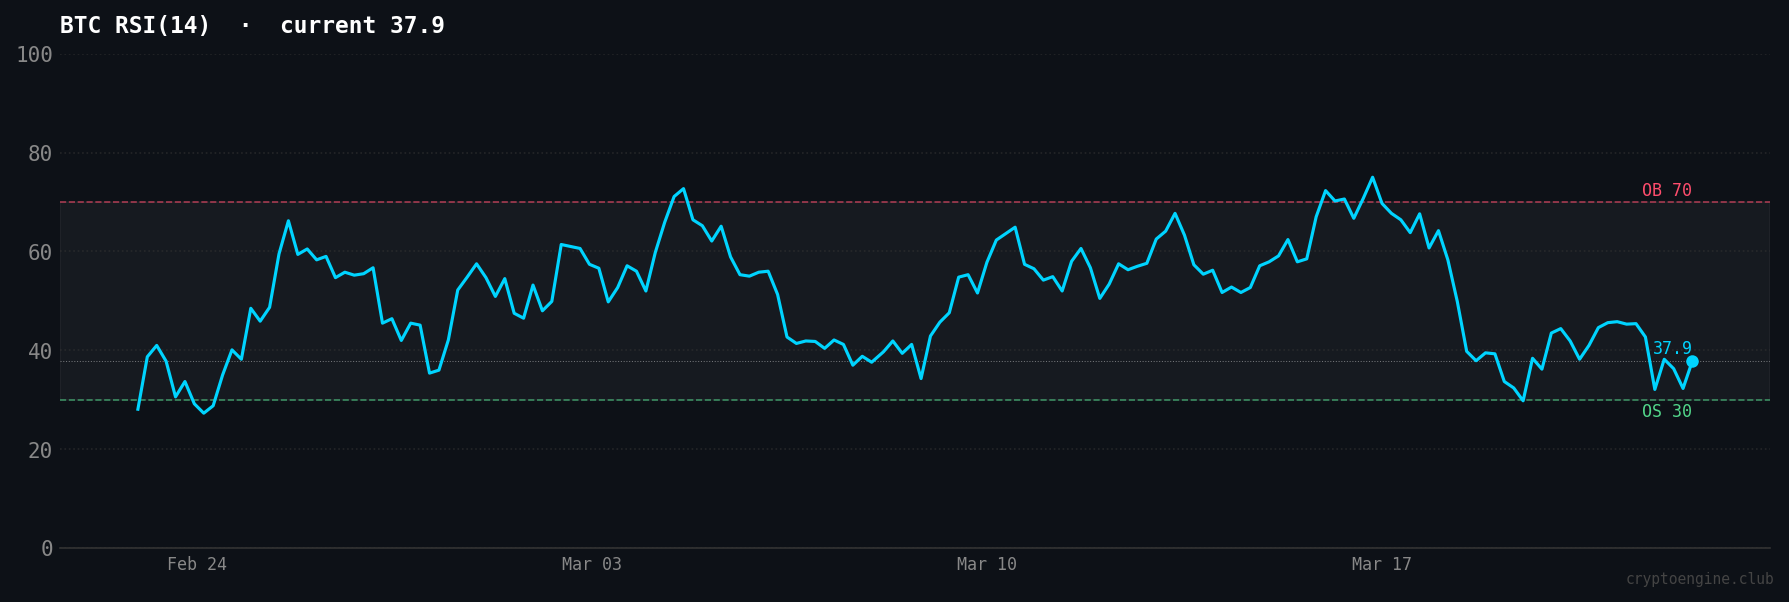
Right now, as of March 24, 2026, BTC RSI(14) reads 37.9. Bitcoin is trading near $68,745, holding roughly flat since the February cycle low of $66,938. That puts RSI in neutral-to-weak territory: not oversold, but close enough that the question is worth asking.
TL;DR
- BTC RSI(14) reads 37.9 as of March 24, 2026, with price near $68,745.
- BTC ATH was $126,080 on October 6, 2025. The drawdown to the February low ($66,938) was 46.9%.
- Over 351 days, RSI was oversold (below 30) on just 15 days and overbought (above 70) on 21 days.
- Average 30-day return after oversold: +1.9%, with 53% positive — barely above a coin flip.
- RSI bottomed at 16.0 on February 6, 2026 — six days before BTC hit its price cycle low. The indicator led price, not followed it.
- RSI works best as a confirmation layer, not a standalone buy signal.
What is RSI and how is it calculated?
The Relative Strength Index is a momentum oscillator that compares the average size of recent up-days to the average size of recent down-days over a rolling 14-period window (14 days on a daily chart). The formula outputs a number from 0 to 100.
The zones most traders use:
- 0–30: Oversold. Price has fallen faster than its recent average and sellers may be running out of steam.
- 30–49: Bearish momentum. Price is weak but not at an extreme.
- 50–69: Bullish momentum. Buyers are leading on balance.
- 70–100: Overbought. Price has risen faster than its recent average and buyers may be stretched.
RSI doesn't predict the next move. It describes the speed and size of moves that already happened. Traders who treat it as a crystal ball are reading the wrong thing.
What one year of RSI data actually shows
We pulled 351 days of daily BTC closes (April 2025 through March 24, 2026) and computed RSI(14) for each day. Here's how the readings broke down:
| Zone | Days | % of period |
|---|---|---|
| Oversold (RSI < 30) | 15 | 4% |
| Neutral (RSI 30–70) | 315 | 90% |
| Overbought (RSI > 70) | 21 | 6% |
RSI spent almost no time at the extremes. 90% of days were in the neutral 30–70 range. That's exactly why the readings outside it carry so much weight when they show up.
The two most interesting data points from this period:
RSI bottomed at 16.0 on February 6, 2026, with BTC at $62,854. BTC's price cycle low didn't come until February 12, when it reached $66,938. RSI hit its floor six days before price did. The momentum indicator saw the exhaustion first. Price confirmed it later.
RSI peaked at 80.0 on May 23, 2025, with BTC at $111,560. That was not the price peak. BTC went on to hit $126,080 on October 6, 2025. RSI crossed into overbought territory early in the rally, then normalized as price continued higher, and never reached overbought again at the final price peak. That's the pattern worth remembering: RSI going overbought early in a move is less meaningful than RSI failing to reach overbought at a later, higher price. The second failure is a warning the first reading wasn't.
What does RSI 37.9 actually mean for Bitcoin right now?
Momentum is weak, but not broken. At 37.9, BTC is in bearish territory without being in full capitulation. You'd expect RSI below 30 during genuine panic, the kind of selling that happened in early February when BTC dropped to $66,938 and the Fear & Greed Index hit 5.
RSI is at 37.9 while price has recovered $1,807 from that low. Momentum ticked up slightly off the bottom but hasn't built into anything. No upward push. No fresh wave of selling either. The market is in a holding pattern.
BTC peaked at $126,080 on October 6, 2025. Over the following five months it shed 46.9% to reach $66,938. A drawdown that size produces a sustained stretch of weak RSI: not one or two oversold spikes, but weeks where the reading hovers in the 30–45 range as price grinds lower or sideways. That's where we are now.
A reading of 37.9 after a 46.9% drawdown is different from 37.9 after a 5% pullback in a bull market. Same number, completely different context. This is why RSI can't be read in isolation.
Does RSI below 30 mean it's time to buy?
Not automatically, no. The logic is sound in theory: if price has fallen faster than usual, sellers may be running out of steam. But the data from the past year says it's close to a coin flip.
Over 351 days, RSI dropped below 30 on 15 days. Looking at 30-day forward returns from each of those days: the average return was +1.9%, and 53% of readings were followed by positive 30-day outcomes. That's barely better than random. The 90-day picture is worse: average return of -7.2%, with only 25% of oversold readings producing a positive 90-day outcome (note: only 8 readings had full 90-day windows, so don't over-index on that figure).
The oversold reading describes a condition, not a turning point. RSI can stay below 30 for days while price continues lower. In early February 2026, it sat below 25 for nearly a week straight while BTC fell from $76,937 to $62,854.
The more useful question isn't "is RSI below 30?" It's "is RSI diverging from price?" That's the signal traders actually rely on.
RSI divergence happens when price makes a new low but RSI makes a higher low. Price is still falling, but the selling momentum is weakening. Fewer sellers are pushing each successive low as hard as the previous one.
Here's what actually happened in this cycle. RSI hit its cycle low of 16.0 on February 6, 2026, with BTC at $62,854. Six days later, BTC made a new price low at $66,938 — but RSI didn't follow. It had already started recovering. That's a real-time example of RSI diverging from price: the new price low wasn't confirmed by new RSI lows, which signaled that selling pressure was fading even before the price bottom was visible. The principle to watch for at any bottom: RSI refusing to confirm what price is doing.
What you want to see to treat a low RSI reading as actionable:
- RSI making a higher low while price tests or undercuts the previous low
- RSI crossing back above 30 (a "recross" often follows sustained bounces)
- Confirmation from price structure: is BTC holding above a known support level?
Right now, none of those are firing cleanly. RSI is at 37.9, holding above 30, without a clear divergence setup. That's not a buy signal. It's a "watch" setup.
Three mistakes traders make with RSI
Mistake 1: Treating the 30 and 70 levels as automatic entries
The 30/70 thresholds are reference points, not triggers. Buying every time RSI crosses below 30 and selling every time it crosses above 70 sounds clean on a chart, but it ignores trend context. In a sustained downtrend, RSI can oscillate between 20 and 50 for months without ever recovering to 70. In a strong bull market, RSI can stay above 60 for extended periods without ever reaching the "oversold" zone that would generate a buy signal using the simple rule.
The threshold matters less than what RSI does at the threshold. Does it bounce quickly? Does it diverge? Does it stay pinned? Those behaviors tell you more than the number itself.
Mistake 2: Using RSI on a single timeframe
A 37.9 reading on the daily chart looks different when the 4-hour RSI is at 28 and the weekly RSI is at 45. Short-term oversold conditions get corrected in hours. Weekly RSI recovering from the 40s takes weeks or months. Traders who only watch one timeframe miss whether the current condition is a brief interruption or a structural shift.
For BTC, the daily chart (RSI 14) is the most-watched timeframe, and that's what the 37.9 reading reflects. But if you're sizing a position based on a daily RSI reading, you should at minimum know what the weekly and 4-hour RSIs look like. All three in the same direction is a cleaner setup than one timeframe flashing a signal while the others are neutral.
Mistake 3: Ignoring what RSI is relative to where price is in its cycle
This is the mistake that costs traders the most money. A reading of 37.9 when BTC is 46.9% below its all-time high means something completely different than 37.9 when BTC is 5% off an ATH. In the first case, you're potentially near a major accumulation zone. In the second, you might be at the start of a much larger correction.
RSI measures momentum, not value. It doesn't know where BTC stands in the broader cycle, and it doesn't account for macro context. During the February 2026 correction, RSI being below 30 didn't tell you whether the $66,938 low was the bottom or the beginning of a longer bear market. Price structure, dominance trends, and sentiment data filled that gap. If you want signals that already layer these inputs together, CryptoEngine's trade alerts combine RSI with Fear & Greed and support/resistance levels into a complete trade plan with a specific entry, stop, and target, so you're not reading one indicator while flying blind on the others.
How RSI fits with other signals right now
As of March 24, 2026: RSI(14) at 37.9, momentum weak but not broken, no divergence setup, no recross above 30 to watch for.
The Fear & Greed Index reads 10 (Extreme Fear). That's one of the deepest sentiment readings of the past year, close to the 5 recorded on February 12 at the cycle low. Sentiment is still near its floor even though price has recovered from $66,938 to $68,745. Buyers are cautious, not confident.
BTC dominance is at 56.3%, still elevated. Traders aren't rotating into altcoins. Risk appetite is low.
All three signals say the same thing: sellers have mostly exhausted their energy (the stabilization above $66,938 shows that much), but buyers haven't stepped in with real conviction. Nobody is forcing a move. RSI won't tell you which way the standoff resolves.
What would make RSI actionable from here? A sustained push above 50 on the daily, especially if it comes with Fear & Greed recovering above 25, would signal that momentum is genuinely shifting. A drop back below 30, particularly if Fear & Greed falls back toward 5 and price undercuts $66,938, would point the other way.
At 37.9, we're between those two scenarios. It's a data point, not a decision.
Frequently asked questions
What is RSI in Bitcoin trading? RSI (Relative Strength Index) is a momentum indicator that measures how fast and far Bitcoin's price has moved in one direction over a set period, typically 14 days. It outputs a number from 0 to 100. Readings below 30 are considered oversold; above 70 are considered overbought. RSI describes current momentum. It does not predict price direction.
What does a Bitcoin RSI of 30 or below mean? An RSI below 30 means BTC has been falling faster than its recent average and selling momentum may be stretched. This has historically clustered near price lows, but oversold conditions can persist for days or weeks before price reverses. Over the past year, only 15 of 351 days saw RSI below 30, and 30-day forward returns from those days averaged +1.9% with 53% positive outcomes. Useful as a "watch closely" signal, not a buy trigger on its own.
What is a good RSI level to buy Bitcoin? There's no single "good" level to buy. Traders who use RSI for entries generally look for a combination: RSI dropping below 30 and then crossing back above it (a recross), or RSI diverging from price (RSI making a higher low while price makes a lower low). Either condition combined with a known support level is more reliable than the oversold reading alone.
Is RSI enough to trade Bitcoin on its own? No. RSI measures one thing: momentum relative to recent history. It doesn't account for trend direction, market cycle position, macro context, or sentiment. Most experienced traders use RSI as one layer in a multi-signal approach, cross-referencing it with price structure, Fear & Greed, and BTC dominance before entering a trade.
What RSI settings work best for Bitcoin? RSI(14) is the standard for daily BTC charts and the most widely watched setting. Short-term traders sometimes use RSI(7), which reacts faster and generates more signals, but also more false ones. Swing traders on weekly charts often use RSI(21) to filter out day-to-day noise. If you're new to RSI, start with 14. The signals are more reliable and you'll be reading the same number most other traders are watching.
What does BTC RSI at 37.9 tell us right now? Momentum is weak but not at a capitulation extreme. At 37.9, BTC is in bearish territory without the selling pressure that drove RSI to 16.0 in early February. Combined with Fear & Greed at 10 and BTC dominance at 56.3%, it describes a market in wait-and-see mode: sellers have pulled back, but buyers haven't stepped in with enough conviction to push RSI toward neutral (50) or higher.
Disclaimer: This article is for educational purposes only and does not constitute financial advice. Past performance does not guarantee future results. Always do your own research before making trading decisions.
Market data via CoinGecko.