BTC Holds $67K as Fear Hits 12: April 5, 2026 Recap
BTC holds $67,004 this week, up 0.7% in 7 days, as Fear & Greed ticks up to 12 (Extreme Fear) and RSI climbs to 47.5 (neutral). The LONG signal fired April 4 at $66,957 on a resistance break — the first clear entry trigger in weeks.
BTC holds $67K as fear hits 12: April 5, 2026 signal recap
Bitcoin closed the week at $67,004, up 0.7% over seven days. The Fear & Greed Index reads 12. Still Extreme Fear, but no longer the 9 it hit last week. RSI(14) climbed from 40.7 to 47.5. And on April 4, CryptoEngine's model issued a LONG signal at $66,957. Technicals improving while sentiment stays depressed — that's a setup worth paying attention to. Here's what the data says.
TL;DR
- BTC is up 0.7% this week, trading at $67,004 as of April 5, 2026.
- The Fear & Greed Index reads 12 (Extreme Fear), up from 9 last week but still deeply in fear territory.
- BTC RSI(14) climbed to 47.5 (Neutral), recovering from 40.7 a week ago.
- BTC dominance stands at 56.3%, holding near multi-year highs.
- CryptoEngine's LONG signal fired April 4 at $66,957, triggered by a resistance break.
Key numbers this week
| Metric | Value | Change |
|---|---|---|
| BTC Price | $67,004 | 🟢 +0.7% (7d), 🔴 -0.5% (24h) |
| ETH Price | $2,044 | 🟢 +2.9% (7d), 🔴 -0.5% (24h) |
| Fear & Greed Index | 12 (Extreme Fear) | — |
| BTC Dominance | 56.3% | — |
| BTC RSI(14) | 47.5 (Neutral) | — |
| Total Market Cap | $2.38T | 🔴 -0.6% (24h) |
| CryptoEngine Signal | LONG | — |
What happened to BTC this week?
Seven days of grinding recovery. Bitcoin opened near $66,500 and closed April 5 at $67,004. The gain is modest at 0.7%, but the character of the week is different from March. Price held the $66,000–$67,000 range without capitulating. RSI moved up, not down. Fear & Greed lifted off its lowest readings.
ETH had a better week than BTC on the percentage basis, up 2.9% to $2,044. Altcoins recovering faster than BTC when sentiment starts lifting is a pattern worth tracking. Total market cap stands at $2.38T.
The macro news this week gave BTC plenty of reasons to sell off. CoinDesk reported that bitcoin sentiment hit its lowest levels since the Iran war began. Riot Platforms sold Bitcoin holdings. The Drift protocol disclosed a $270 million exploit traced back to a six-month North Korean intelligence operation. BTC held $67,000 through all of it. That matters.
Charles Schwab opened a waitlist for direct BTC and ETH spot trading, targeting a Q2 limited launch. The market didn't react this week, but the institutional on-ramp keeps expanding.
What does a Fear & Greed score of 12 tell you right now?
The Fear & Greed Index is a composite sentiment reading that runs from 0 (Extreme Fear) to 100 (Extreme Greed). A score of 12 puts the market well below the 25 threshold that separates Extreme Fear from Fear. Moving from 9 to 12 in one week is progress, but it's not recovery.
Scores in the 9–15 range tend to cluster around significant stress events. They can persist for weeks before reversing. Fear is clearly elevated. The real question is whether the floor is in. And for that, you need to look at momentum.
As the gauge below shows, sentiment is still compressed near the bottom of the range:
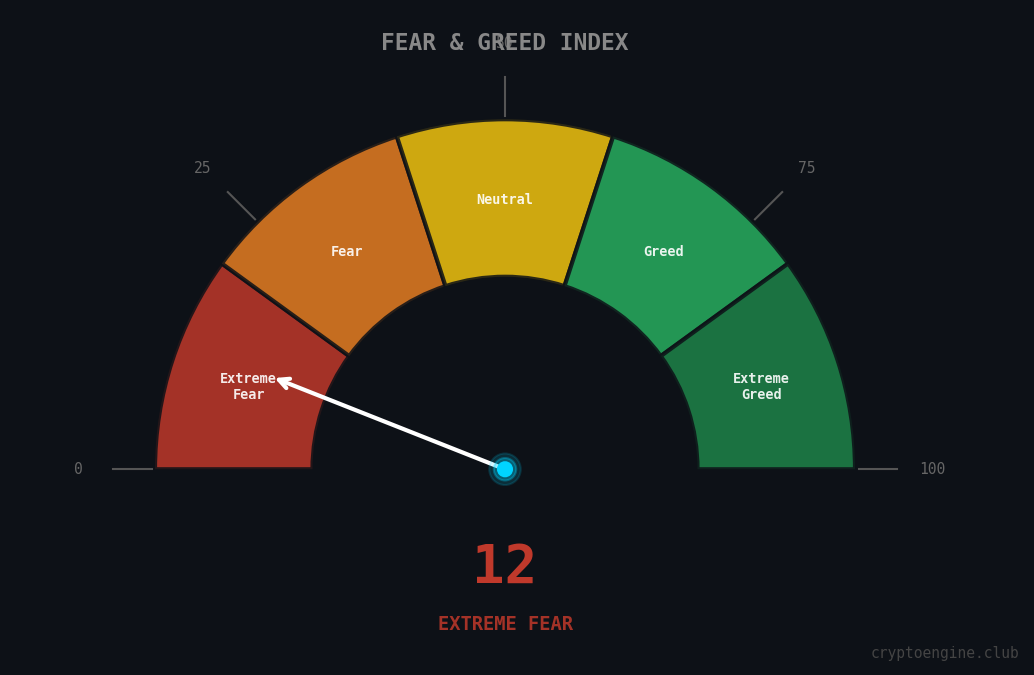
Extreme fear alone is not a signal. It tells you panic is real. Whether that panic is about to reverse depends on what the technicals are doing.
Is RSI at 47.5 confirming a recovery or just bouncing?
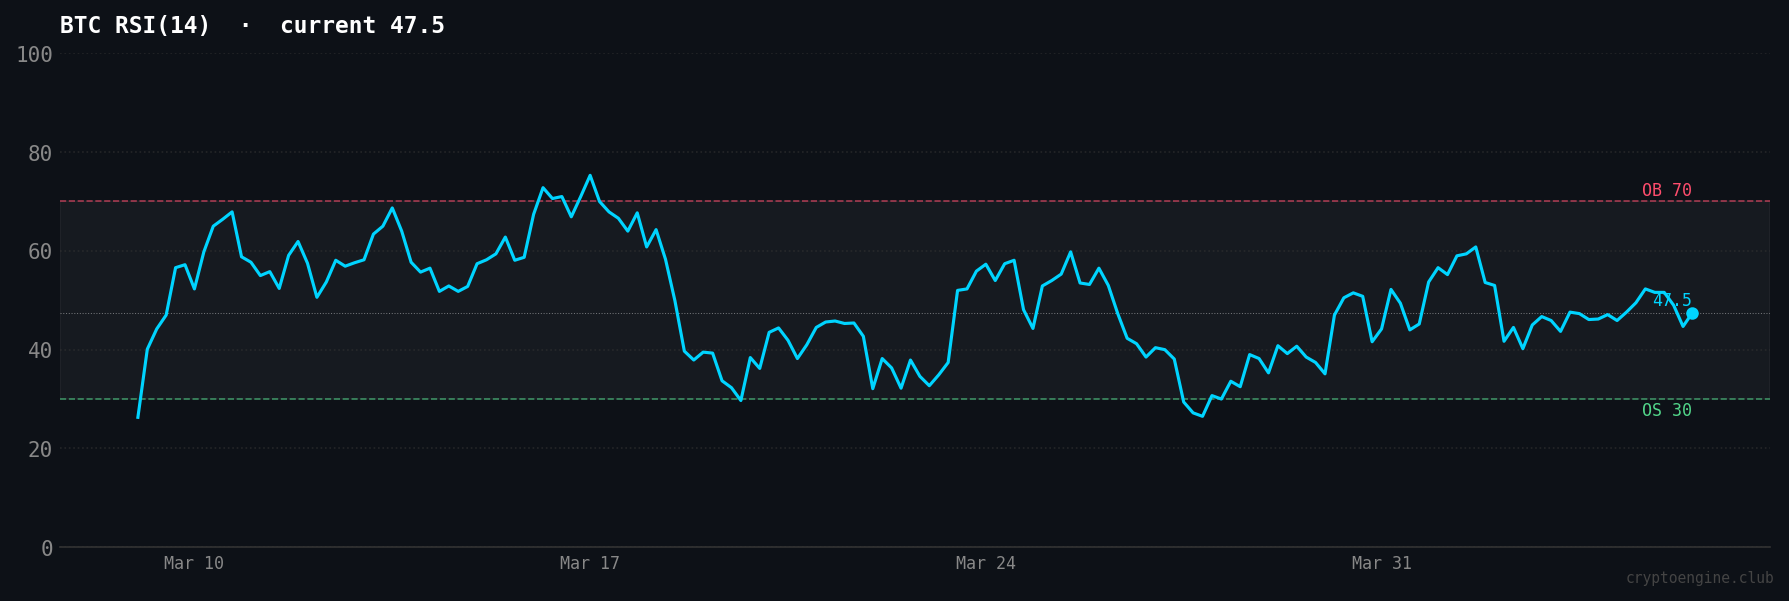
RSI jumped from 40.7 (March 29) to 47.5 this week. That's a 7-point move in seven days while price gained less than 1%. Momentum recovered faster than price did. Something changed under the surface.
RSI(14) at 47.5 is neutral: below the 50 midpoint, not yet confirming an uptrend, but no longer confirming the downtrend either. Three weeks ago RSI was heading lower. Now it's heading higher. If you want to understand how RSI signals work in practice, this breakdown of Bitcoin RSI entry and exit signals covers the mechanics in full.
The critical level to watch: 50. An RSI crossing above 50 signals that bullish momentum has overtaken bearish. Right now at 47.5, the market is at the inflection point, not through it.
The chart below shows the 30-day RSI trend and where momentum currently sits:
Fear compressed to historic lows in March while RSI started recovering before price did. CryptoEngine's model is built to catch exactly that kind of setup, which is why the LONG signal fired April 4 and not a week earlier.
How the signal has performed
CryptoEngine's LONG signal fired on April 4, 2026, with BTC at $66,957. The model identified a "downtrend breaking above resistance" as the trigger.
As of April 5, BTC trades at $67,004. That's a +0.07% gain on the entry, essentially flat in one day. This is a fresh signal with no completed period to evaluate. No exit has fired yet, so there's no verdict to give.
What the model identified was a structural shift. BTC had been grinding lower through March. Fear & Greed compressed to historic lows while RSI started recovering before price did. When resistance broke, the conditions aligned and the signal fired.
The honest read: this is an early position in a setup that hasn't proven itself yet. The $66,957 entry is the reference point. Whether it becomes a clean trade or gets stopped out depends on what BTC does over the next several days.
If you want to track the signal as it develops, CryptoEngine's signal dashboard updates daily.
What to watch heading into next week
Fear & Greed above 25 is the first target. That's the line between Extreme Fear and regular Fear. It doesn't mean recovery is certain, but it signals that the acute panic is easing. Sentiment tends to lead price out of bottoms, not follow it.
RSI at 50 is the momentum level to watch. At 47.5 now, it's two points away from flipping neutral-to-bullish. If it stalls at 48 and reverses, the setup gets messier. If it pushes through 50, the recovery story gets a lot cleaner.
Dominance at 56.3% is still elevated. When it starts pulling back while BTC holds or rises, that's when altcoin risk appetite comes back. Right now capital is still concentrated in BTC.
The $66,957 signal entry is the reference level. How BTC handles $67,000 this week tells you whether the resistance break was real. A close below $66,000 would be the warning sign that it wasn't.
Frequently asked questions
Is Fear & Greed at 12 a buy signal for Bitcoin? A Fear & Greed reading of 12 indicates Extreme Fear, but it is not a standalone buy signal. Extreme fear can precede bounces, but it can also persist for weeks. When Extreme Fear aligns with RSI recovering from below 40 (as it is right now), the combined setup is more actionable than sentiment alone. CryptoEngine's model requires both conditions to align before issuing an entry.
What does BTC RSI at 47.5 mean for traders? BTC RSI(14) at 47.5 is a neutral reading, sitting just below the 50 midpoint and recovering from 40.7 last week. RSI measures momentum, not price direction directly. A reading climbing from the low 40s toward 50 signals that downward momentum is fading. It is not yet a confirmation of a new uptrend, but it is no longer confirming the downtrend that ran through March.
Why is BTC dominance at 56.3% relevant to altcoin traders? Bitcoin dominance is the percentage of total crypto market cap held in BTC. At 56.3%, Bitcoin holds more than half of all crypto value, which is a risk-off posture. When dominance is high, altcoins typically underperform or trade sideways even when BTC stabilizes. A pullback in dominance is often one of the first signals that broader risk appetite is returning to the market.
Why did CoinDesk say bitcoin sentiment hit its worst level since the Iran war? The headline refers to the Fear & Greed Index touching single-digit readings not seen since the period of acute geopolitical stress during the Iran conflict. It reflects how broadly negative sentiment became over the past few weeks, driven by a combination of macro uncertainty, miner selling, and the Drift exploit news. The index has since recovered slightly from 9 to 12, but remains in Extreme Fear territory as of April 5, 2026.
Disclaimer: This article is for educational purposes only and does not constitute financial advice. Past performance does not guarantee future results. Always do your own research before making trading decisions.