BTC signal recap April 14, 2026: fear still extreme
BTC trades at $74,047 on April 14, 2026, up 7.3% in 7 days, with Fear & Greed at 21 and RSI at 61.6. CryptoEngine's April 5 LONG from $66,957 is up 10.6%, which matters because price has recovered faster than sentiment.
BTC signal recap April 14, 2026: fear still extreme
BTC finally gave traders something better than a dead-cat bounce. Price is $74,047, up 7.3% over the last seven days, and RSI(14) has pushed to 61.6. But sentiment has barely moved. The Fear & Greed Index is still 21, which is firmly in Extreme Fear. That gap between stronger price action and still-shaky sentiment is the real story in this recap.
TL;DR
- BTC is trading at $74,047 as of April 14, 2026, up 7.3% over the past 7 days and 1.1% in 24 hours.
- The Fear & Greed Index reads 21, which still counts as Extreme Fear.
- BTC RSI(14) is 61.6, a clear improvement from the neutral readings that defined the prior setup.
- CryptoEngine's active LONG from April 5 at $66,957 is up 10.6%.
- The market has recovered faster than sentiment, which usually tells you traders still do not fully trust the move.
Key numbers this week
| Metric | Value | Change |
|---|---|---|
| BTC Price | $74,047 | 🟢 +7.3% (7d), 🟢 +1.1% (24h) |
| ETH Price | $2,319.74 | 🟢 +9.9% (7d), 🟢 +2.7% (24h) |
| Fear & Greed Index | 21 (Extreme Fear) | — |
| BTC Dominance | 57.3% | — |
| BTC RSI(14) | 61.6 (Neutral) | — |
| Total Market Cap | $2.59T | 🟢 +1.0% (24h) |
| CryptoEngine Signal | LONG | — |
What happened to BTC this week?
BTC added 7.3% over seven days and is back above $74,000. ETH did even better on a percentage basis, up 9.9% to $2,319.74, while total market cap rose to $2.59T. BTC dominance is still high at 57.3%, so this is still a Bitcoin-led tape, not a broad alt rotation.
The news flow matched that tone. CoinDesk reported that a $76,000 breakout attempt failed, but the same piece pointed to a rare signal that may indicate a major bottom. At the same time, Goldman Sachs filed for a bitcoin income ETF tied to options, and several outlets covered fresh institutional crypto exposure around Fed chair nominee Kevin Warsh. So this move is happening with institutions leaning in, not with traders inventing a story out of thin air.
What stands out is that BTC has managed this recovery while the mood still looks defensive. Traders are bidding price higher, but they still do not look comfortable.
What does Fear & Greed at 21 mean if BTC is already back above $74K?
The Fear & Greed Index is a sentiment gauge from 0 to 100. A 21 reading still means Extreme Fear. In plain English, the panic has cooled a bit, but nobody is relaxed.
That matters. When BTC rallies while fear stays elevated, a lot of traders hesitate to chase it, and dips get bought because positioning is still light. I would rather see that than a move fueled by instant euphoria.
As the gauge below shows, sentiment is still compressed in the lower band even after this week's price rebound:
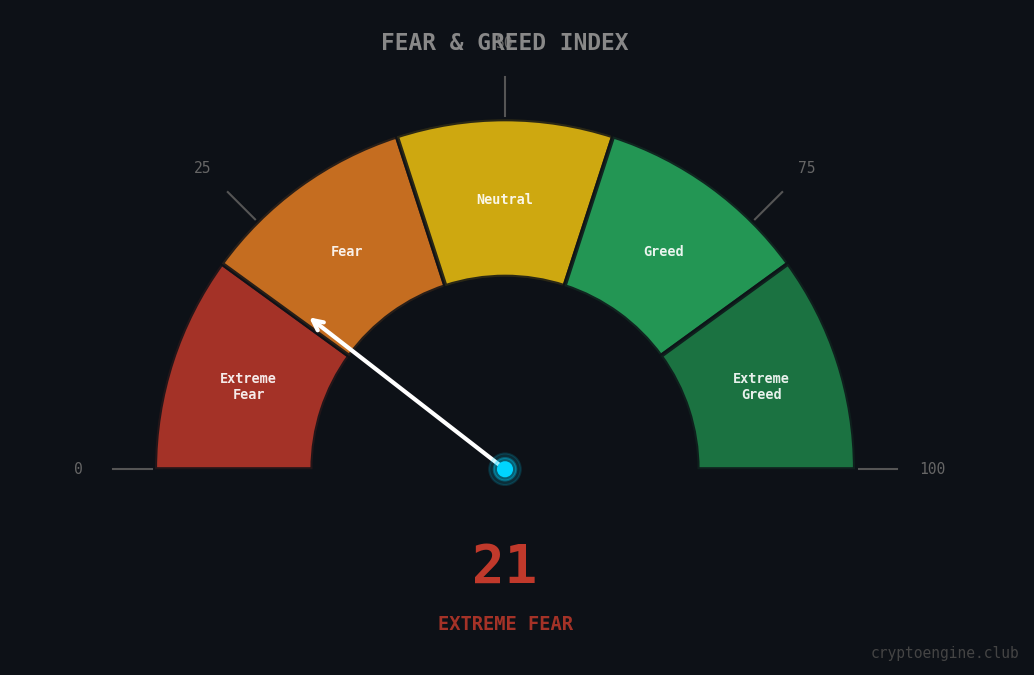
If this number pushes above 25 next, that would mark a shift out of Extreme Fear. We are not there yet. Price has recovered faster than trader psychology.
Is RSI at 61.6 telling traders the move is real?
RSI(14) at 61.6 is much stronger than the market had during the April 5 signal setup. It is not overbought, but it is clearly on the bullish side of neutral. That tells you momentum has improved enough to support price, not just lag behind it.
A reading above 60 looks very different from an oversold bounce that dies in the 40s. This move has follow-through behind it. If you want the deeper mechanics, this guide to Bitcoin RSI entry and exit signals explains how traders use the indicator in practice.
The 30-day chart below shows how momentum has climbed:
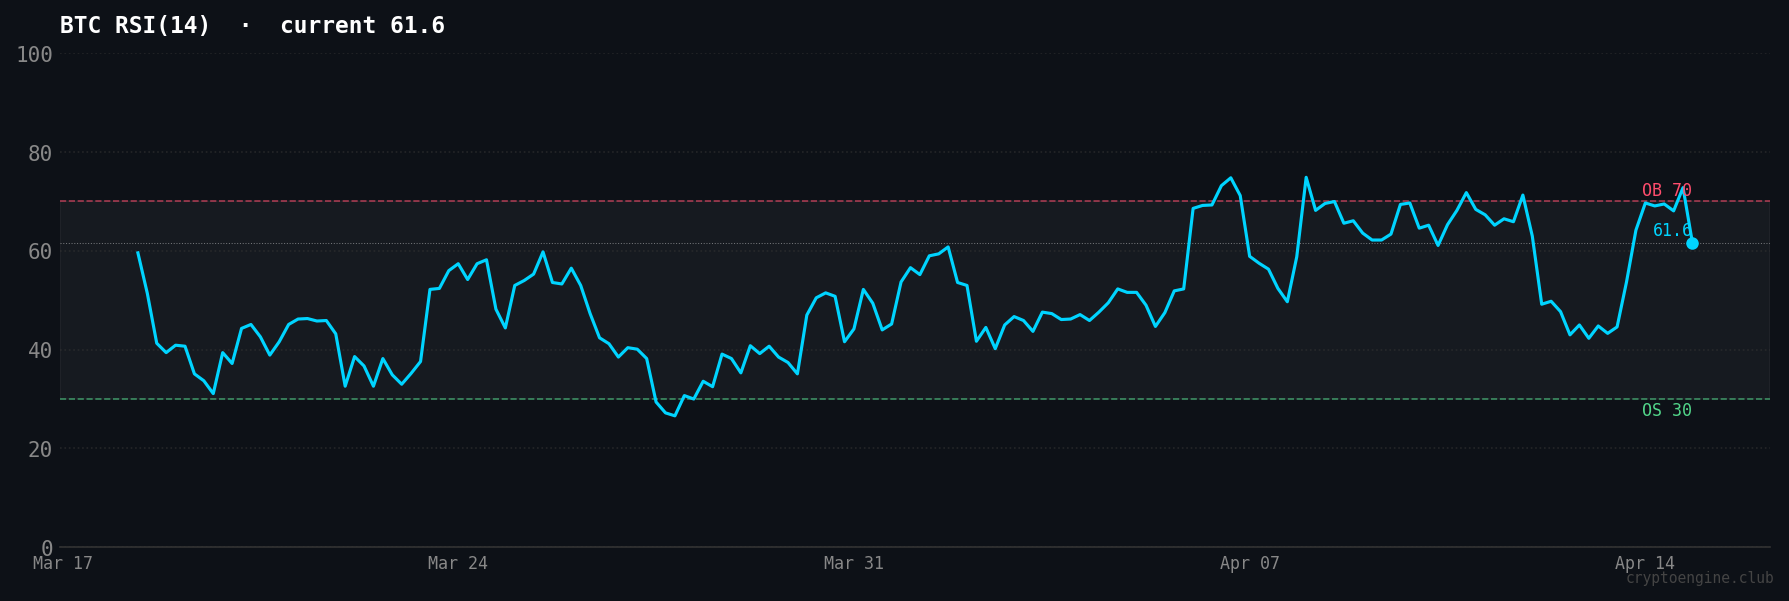
The simple read: RSI is confirming strength, and it is not flashing an exhaustion warning yet. That keeps the current LONG setup intact.
What should traders watch next week?
First, watch whether BTC can hold above the low-$74,000 area after this push. If it can, the bid is real.
Second, watch the Fear & Greed Index. If price stays strong and the index finally climbs out of Extreme Fear, that would show the market is starting to believe the move. If BTC chops sideways while fear stays pinned low, it probably needs more time before the next leg.
Third, keep an eye on dominance at 57.3%. High dominance means BTC is still where traders hide when they want crypto exposure with less risk. If dominance falls while BTC stays firm, that would open the door to broader risk appetite.
The cleanest read today is that BTC has momentum, but sentiment still has room to catch up. I would rather trade that than the reverse.
Frequently asked questions
Why is BTC up while Fear & Greed is still at 21? Price and sentiment do not move at the same speed. BTC can recover before traders feel confident again, especially after a fearful stretch. That is often what early recoveries look like.
Is RSI at 61.6 overbought for Bitcoin? No. An RSI of 61.6 is bullish, but it is not an overbought reading. It says momentum has improved without yet signaling that the move is stretched.
How much is CryptoEngine's April 5 LONG up right now? The active LONG fired at $66,957 on April 5, 2026. With BTC at $74,047 on April 14, the open position is up 10.6%.
What does BTC dominance at 57.3% tell you? It says Bitcoin still represents most of the market's risk appetite. Traders are leaning into BTC before they rotate harder into altcoins.
Disclaimer: This article is for educational purposes only and does not constitute financial advice. Past performance does not guarantee future results. Always do your own research before making trading decisions.
Market data via CoinGecko. News sources: CoinDesk, Decrypt, The Block.