Bitcoin at $63,053, Fear at 27: August 2 Signal Recap | Crypto Engine
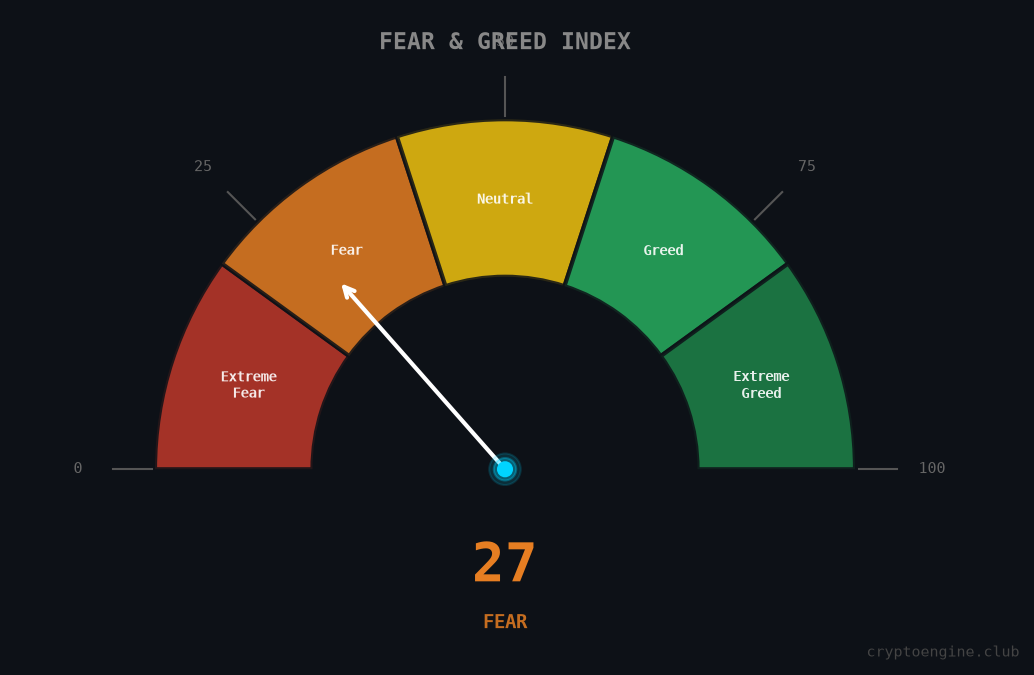
CryptoEngine's July 30 LONG entered at $64,803 is down 2.7% as BTC trades at $63,053. Fear and Greed reads 27 (Fear); RSI(14) at 43. An $89M Coldcard exploit drove unusual exchange inflows this week.
Bitcoin at $63,053, Fear at 27: August 2 Signal Recap | Crypto Engine Research
This bitcoin signal recap covers the week of August 2, 2026. BTC is trading at $63,053, down 2.5% over seven days. Fear & Greed reads 27. RSI sits at 43. The price move is secondary: an $89 million cold wallet exploit pushed BTC back onto exchanges for the first time since the FTX collapse in 2022.
TL;DR
- BTC fell 2.5% over the past 7 days to $63,053 as of August 2, 2026.
- CryptoEngine's July 30 LONG entered at $64,803 is currently down 2.7% from entry.
- The prior SHORT signal (July 27) returned +2.0% over five days before the system flipped to LONG.
- Fear & Greed reads 27 (Fear); BTC RSI(14) is at 43.0 (Neutral).
- An $89 million Coldcard exploit hit 4,500 wallets, driving exchange inflows not seen since 2022.
Key Numbers This Week
| Metric | Value | Change |
|---|---|---|
| BTC Price | $63,053 | 🔴 -2.5% (7d) |
| ETH Price | $1,857 | 🔴 -2.1% (7d) |
| Fear & Greed Index | 27 (Fear) | — |
| BTC RSI(14) | 43.0 (Neutral) | — |
| BTC Dominance | 56.3% | — |
| Total Market Cap | $2.25T | — |
| CryptoEngine Signal | LONG | — |
What Happened to BTC This Week?
BTC opened the week near $65,000 and closed August 2 at $63,053, a 2.5% loss over seven days. The selling has been grinding, not violent: lower highs at each bounce attempt, no clean flush.
The Coldcard exploit changed the week's tone. Attackers drained roughly $89 million from 4,500 cold wallet addresses. CoinDesk reports this event is doing something unusual: unlike the FTX collapse, which triggered mass exchange withdrawals, holders are now sending BTC back onto exchanges to restructure custody. CZ publicly urged wallet diversification. If that supply keeps hitting order books in the $62,000–$63,000 range, any rally attempt faces real headwinds.
A few other developments ran in the background this week:
- Bitcoin mining difficulty dropped 14% from this year's high as revenue pressure forces miners offline. Lower hashrate tends to reduce daily miner selling, a tailwind that's easy to overlook in a week with bigger headlines.
- Trump Media moved $165 million in BTC to Crypto.com, confirmed as a custody transfer rather than a sale.
- The SEC announced it would review Nasdaq's bitcoin options approval following a CME challenge.
- BTC dominance held at 56.3%. No rotation into altcoins.
How the Signal Has Performed
CryptoEngine called a SHORT on July 27. Over five days, that position returned +2.0% as BTC slid from the mid-$60,000s. That completed signal brings the system to 10 correct calls out of the last 10 measured at the five-day mark.
On July 30, the signal flipped to LONG with the reason "Downtrend breaking above resistance." Entry price: $64,803. As of August 2, BTC trades at $63,053, putting the position down 2.7% from entry.
Three trading days in, the position is underwater. The signal read that the sell-off had run its course and BTC was set to reclaim resistance. That hasn't happened yet. No exit has triggered — the position is open and being tested. If BTC recovers above $64,800, the call looks early rather than wrong. If $62,000 breaks cleanly, the path toward $58,000–$59,000 opens up.
What Does Fear at 27 Mean for BTC Right Now?
Fear & Greed at 27 places sentiment in the fearful range. Not extreme fear, which historically requires a reading below 20, but well inside defensive territory. Readings at this level have coincided with short-term bounces in past cycles, though that only holds when selling pressure from external events isn't adding supply at the same time.
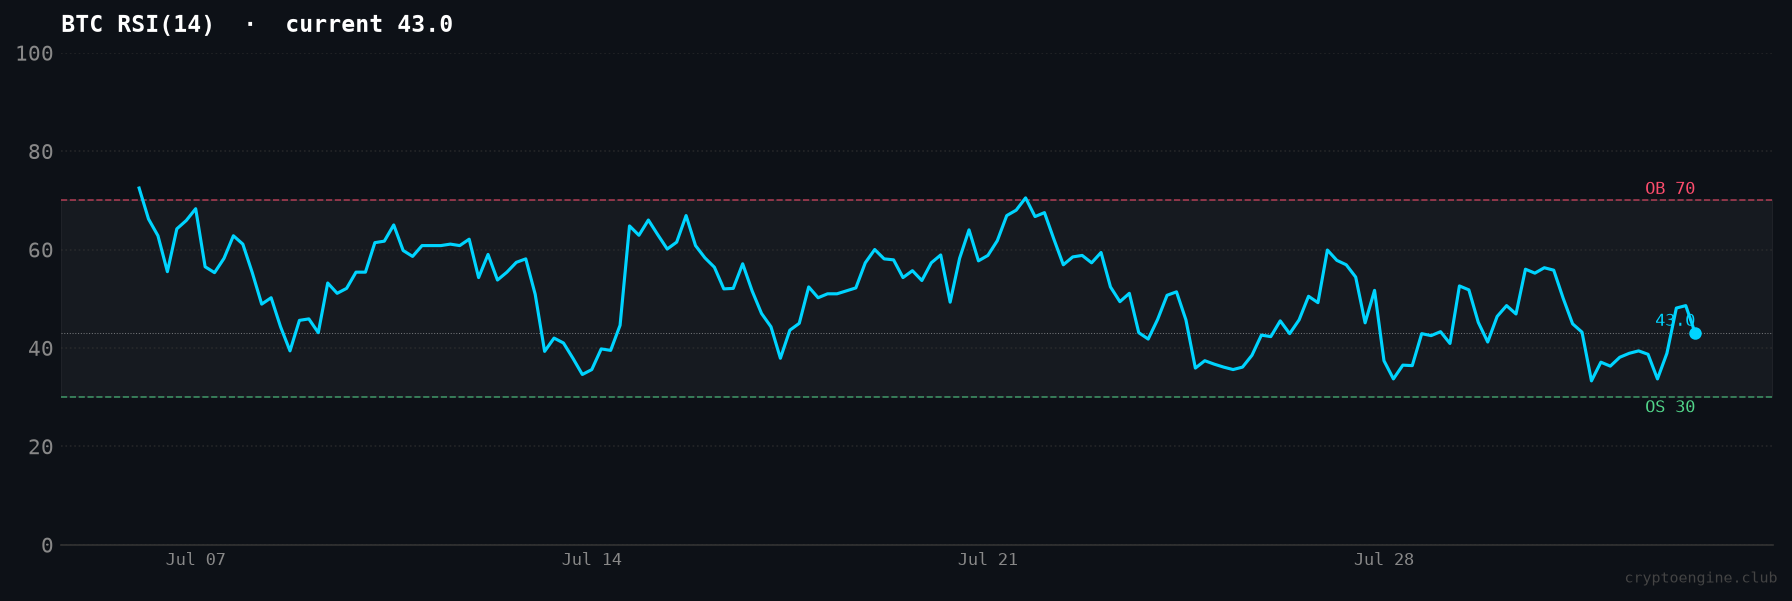
BTC RSI(14) at 43.0 sits in neutral-to-bearish territory. RSI below 30 is oversold; above 70 is overbought. At 43, sellers have a slight edge but the market isn't showing capitulation. Past bounces off the $62,000–$63,000 range have happened with RSI and Fear & Greed near current levels. Whether that pattern holds depends partly on how much exchange supply the Coldcard event generates over the coming days.
Two key levels: $62,000 is the structural support that has held twice this month. On the upside, $64,803 is the LONG entry. Reclaiming it would confirm the signal's original thesis.
What to Watch Going Into Next Week
The Coldcard story isn't resolved. Losses now exceed $89 million across 4,500 addresses and the event is still spreading. Watch whether exchange inflows continue building or start to taper off. That tells you whether the custody migration is nearly complete or still in progress.
Mining difficulty dropped 14% from the year's high, signaling deteriorating economics at $63,000. If BTC slides further, more miners may sell reserves to cover costs.
On the macro side: the SEC's review of Nasdaq's bitcoin options approval could either stall options market development or become a non-event. Watch for any ruling that reshapes the institutional access story.
If you want a systematic signal layer on top of your own read, see how CryptoEngine handles these setups. Fear in the 20s, RSI neutral-to-bearish, trend direction unclear: that's where the system's 10/10 recent win rate (5d) was built.
For context on how the previous week's SHORT played out, see the July 26 signal recap.
Frequently Asked Questions
What does this bitcoin signal recap show for August 2, 2026? CryptoEngine's active signal is a LONG, entered on July 30, 2026 at $64,803. As of August 2, BTC trades at $63,053, putting the position down 2.7% from entry. The prior signal, a SHORT fired July 27, returned +2.0% over five days.
Where does the Fear & Greed Index stand as of August 2, 2026? The Fear & Greed Index reads 27 (Fear) as of August 2, 2026. This places sentiment in the fearful range but not yet at extreme fear, which typically requires a reading below 20.
What happened to BTC this week? Bitcoin fell 2.5% over the seven days ending August 2, 2026, settling at $63,053. The main event was an $89 million exploit targeting Coldcard cold wallets. Attackers drained funds from 4,500 addresses and triggered the first major exchange inflow spike since the FTX collapse in 2022.
What does BTC RSI at 43 indicate? An RSI of 43 sits in the neutral-to-slightly-bearish zone. Values below 30 indicate oversold conditions; above 70 signals overbought. At 43, sellers have a slight edge but the market is not yet showing the capitulation readings that historically precede sharp recoveries.
Is Bitcoin in a bear market right now? Bitcoin is down 2.5% over 7 days but up 1.5% over the past 30 days, trading at $63,053 as of August 2, 2026. Total market cap sits at $2.25T and BTC dominance is 56.3%. Those figures describe a soft consolidation, not a clear bear trend, though the Coldcard exploit adds a supply dynamic that wasn't present in previous sideways periods.
Disclaimer: This article is for educational purposes only and does not constitute financial advice. Past performance does not guarantee future results. Always do your own research before making trading decisions.
Market data via CoinGecko. News sources: CoinDesk, The Block.