Bitcoin at $77,100, Greed at 66: August 23 Signal Recap | Crypto Engine Research
CryptoEngine's Aug 19 LONG entered at $69,221 is up 11.4% as BTC trades at $77,100, up 22.5% in 7 days. Fear and Greed reads 66 (Greed), RSI at 71.4 (overbought). Bitcoin bears took $2.6B in ETF inflows to the face this week.
Bitcoin at $77,100, Greed at 66: August 23 Signal Recap
Bitcoin closed the week at $77,100, up 22.5% in seven days, after a squeeze-led rally wiped billions in short positions and pulled in $2.6 billion in ETF inflows — the strongest weekly flows since October. The CryptoEngine LONG signal fired on August 19 at $69,221 and is up 11.4% since entry.
TL;DR
- BTC trades at $77,100 as of August 23, 2026, up 22.5% over the past 7 days.
- CryptoEngine's LONG signal fired August 19 at $69,221 and is up 11.4% since entry (server-computed 3-day return: +13.4%).
- Fear & Greed reads 66 (Greed) and BTC RSI is at 71.4, overbought territory.
- Bitcoin and ether ETFs drew $2.6 billion in inflows this week, their strongest week since October 2025.
- CryptoEngine's win rate: 10/10 correct on a 5-day horizon across the last 10 completed signals.
Key Numbers This Week
| Metric | Value | Change |
|---|---|---|
| BTC Price | $77,100 | 🟢 +22.5% (7d), 🔴 -0.1% (24h) |
| ETH Price | $2,431 | 🟢 +29.7% (7d) |
| Total Market Cap | $2.61T | 🔴 -2.9% (24h) |
| BTC Dominance | 59.2% | — |
| Fear & Greed | 66 (Greed) | — |
| BTC RSI(14) | 71.4 (Overbought) | — |
| CryptoEngine Signal | LONG | — |
How Did BTC Rally 22% in One Week?
A Treasury buyback policy change sparked the initial move. CoinDesk reported the tweak triggered a wave of short liquidations. Bitcoin jumped from roughly $63,000 to briefly touch $79,000 in days, with the squeeze wiping out bearish positions. Washington's Clarity Act push added fuel: bipartisan legislative momentum on crypto regulation sent risk appetite higher across markets.
ETF flows cemented it. Bitcoin and ether ETFs pulled in $2.6 billion this week, tripling the prior week's volume according to The Block, the strongest inflow week since October 2025. Institutional inflows at that scale lift price and absorb sell pressure. The move was cleaner for it.
None of this was retail FOMO leading the charge. Google Trends shows "why is bitcoin going up" spiked 2,500% this week. People were searching mid-rally, not buying ahead of it. That's a different dynamic than a retail-driven pump.
How the Signal Has Performed
The August 19 LONG is the active position. Entry was at $69,221; BTC trades at $77,100 as of Sunday. That's up 11.4% since entry in four days, with the server-computed 3-day signal return at +13.4%.
The prior completed signal was a LONG that fired August 5, returning +1.0% at five days. Modest, but correct. The market was grinding sideways in the $62,000-$66,000 range; the signal held long through the chop. A July 30 LONG before that returned +0.6% at five days: another quiet win in consolidation.
The two signals before those were SHORTs. The July 27 SHORT returned +2.0% at five days; the July 24 SHORT returned +2.6% at ten days. Both called the downside when market structure was deteriorating.
Win rate: 10/10 correct on a 5-day horizon across the last 10 completed signals. Correct on both LONG and SHORT calls, in trending and choppy conditions. The August 19 LONG, up 11.4% in four days, is the strongest return in the recent run by a wide margin.
How Has Our Public Signal History Performed Since April?
We started using the strategy to manage our own money on April 3, so this is a since-inception snapshot, not a full calendar-year YTD result. To keep the comparison consistent, the chart below tracks the normalized public signal-history equity curve rather than brokerage-account profit and loss. From April 3 through August 21, that curve rose from 1.0000 to 1.3614, a +36.14% return.
Over the same window, buy-and-hold BTC returned +17.04%. That put the public signal-history curve 19.10 percentage points ahead of BTC during the period.
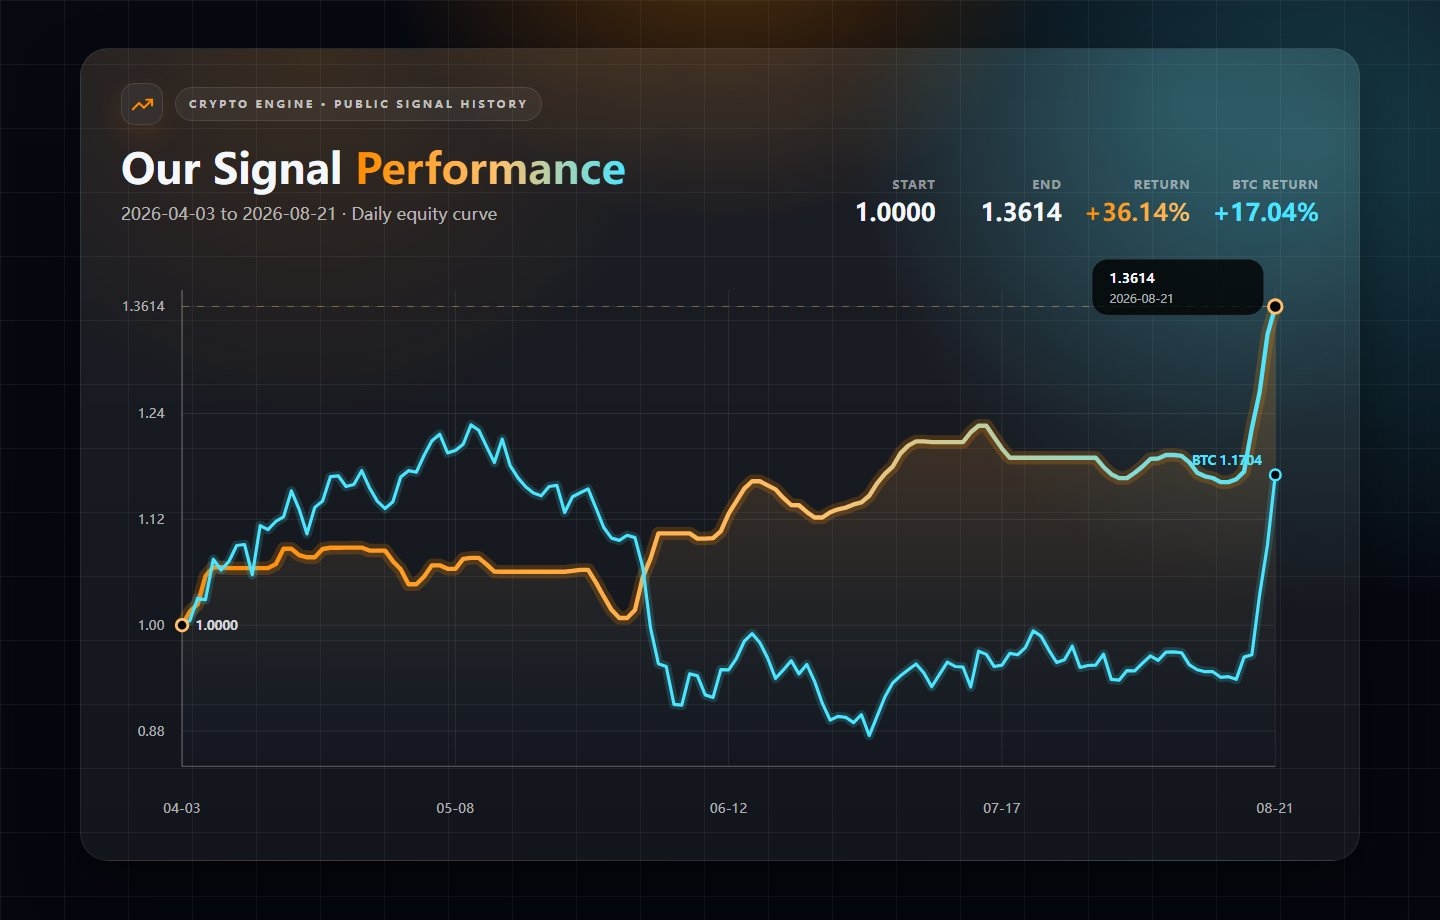
This is still a short track record, and the path was not smooth. It is not an audited account statement and does not account for each reader's fees, slippage, position sizing, or execution. These results show what happened during this specific period, not what the strategy will return next. Past performance does not guarantee future results.
What Does the Fear & Greed Index Say Right Now?
Fear & Greed reads 66 as of August 23, firmly in Greed territory. A month ago, readings sat in the 26-34 range (Fear). That's a full regime flip in four weeks.
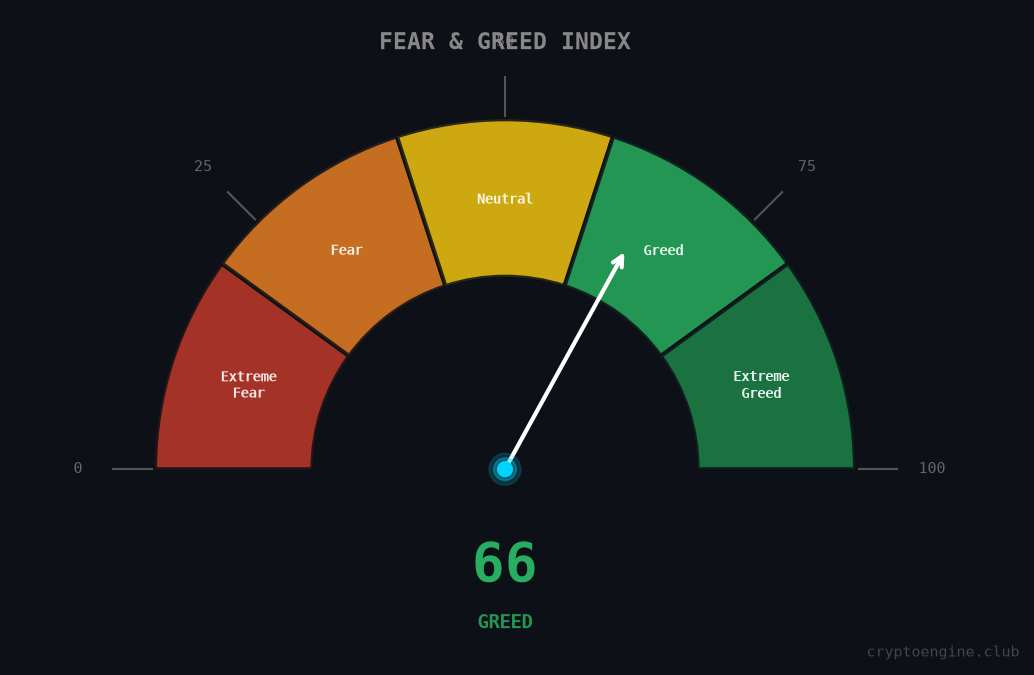
Greed at 66 doesn't mean the top is in. Markets can sustain Greed readings for weeks before sentiment pushes into Extreme Greed (80+). What matters here is the rate of change: going from Fear (26) to Greed (66) in four weeks is fast. Fast regime flips often carry further than most expect before reversing.
The risk is complacency. When sentiment recovers this quickly, the market is pricing in continued good news. A policy reversal or a weak ETF flow week next quarter could cause a sharp reset.
What Is RSI Telling Us About the Next Move?
BTC RSI(14) sits at 71.4, which is technically overbought. That's not a sell signal on its own. Overbought RSI during a strong trend is normal.
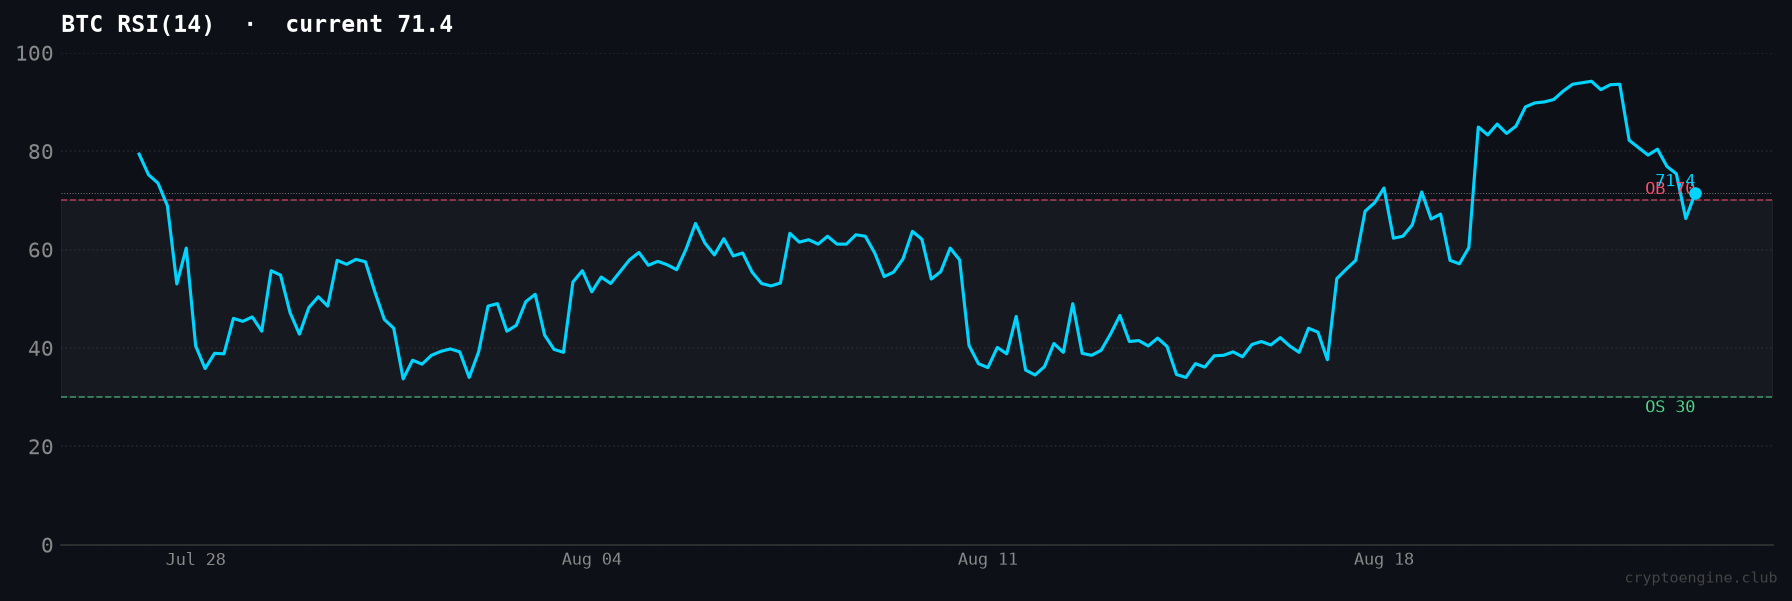
RSI can hold above 70 for extended periods when momentum is real, which this rally appears to be given the institutional ETF flows and short squeeze mechanics behind it. The signal to watch is RSI divergence: if BTC makes a higher high next week but RSI prints a lower high, that's when the overbought reading becomes actionable.
For now: trend is up, signal is long, RSI is overbought in a trending market. That's a different setup than overbought RSI in a range.
What to Watch Into Next Week
Price action around $77,000-$79,000 is the near-term test. BTC touched $79,000 intraday this week; whether it holds above $77,000 or pulls to $72,000-$74,000 determines the short-term structure.
RSI at 71.4 and Fear & Greed at 66 still leave room before Extreme Greed (80+). A mild pullback here would be healthy and wouldn't necessarily flip the signal.
ETF flow data next week will be the real tell. Flows above $1 billion confirm the institutional bid is still active. A sharp drop suggests the week's rally may struggle to extend past current resistance.
If you'd rather have a data-driven signal watching all of this for you, CryptoEngine's signals track RSI, Fear & Greed, and price structure together and deliver a complete trade plan with entry, stop, and target.
Frequently Asked Questions
What is a bitcoin signal recap? A bitcoin signal recap covers the week's BTC price action alongside a trading signal service's performance. It shows what the signal called, what the market did, and whether the call was right, with exact entry prices and returns so traders can evaluate signal quality over time.
Is bitcoin overbought at RSI 71.4? RSI(14) above 70 is technically overbought, but overbought does not mean an imminent reversal. In trending markets, RSI can hold above 70 for weeks. The more reliable warning is RSI divergence: price makes a higher high while RSI makes a lower high. That matters more than the absolute level crossing 70.
Why did bitcoin rally 22% in 7 days in August 2026? As of August 23, 2026, the rally combined a Treasury buyback policy change, a short squeeze that liquidated billions in bearish positions, and $2.6 billion in spot ETF inflows, the strongest weekly ETF flows since October 2025.
What does Fear & Greed at 66 mean for BTC price? A reading of 66 places the market in Greed territory, up from Fear (26-34) just a month ago. Sustained Greed is normal during bull runs. The risk is that it reflects pricing in good outcomes, leaving the market more vulnerable to negative surprises.
How accurate is CryptoEngine's signal? As of August 23, 2026, CryptoEngine shows a 10/10 win rate on a 5-day horizon across the last 10 completed signals, covering both LONG and SHORT calls in trending and choppy market conditions.
Disclaimer: This article is for educational purposes only and does not constitute financial advice. Past performance does not guarantee future results. Always do your own research before making trading decisions.
Market data via CoinGecko. News sources: CoinDesk, The Block.