Bitcoin at $64,527, Fear at 28: July 19 Signal Recap | Crypto Engine Research
CryptoEngine's July 14 LONG entered at $64,829 is up 0.9% (3d). BTC trades at $64,527. Fear & Greed reads 28 (Fear), RSI 54.3 (neutral). Options markets are pricing a push to $72k by month end, ahead of the Fed meeting.
Bitcoin at $64,527, Fear at 28: July 19 Signal Recap
This bitcoin signal recap covers the week ending July 19, 2026. CryptoEngine's July 14 LONG entered at $64,829. Three days in, the system registers +0.9% and no exit trigger has fired. BTC trades at $64,527, just below the entry point. Fear & Greed sits at 28 (Fear), which is lower than you'd expect given where price is. RSI reads 54.3: neutral, with room above.
TL;DR
- CryptoEngine's July 14 LONG entered at $64,829 is up 0.9% at 3 days as of July 19, 2026. No exit has triggered.
- BTC trades at $64,527, up 0.8% over the past 7 days and 0.7% in the last 24 hours.
- Fear & Greed Index reads 28 (Fear) — retail sentiment hasn't matched the price level.
- RSI(14) sits at 54.3, above the 50 midline but well below overbought territory at 70.
- Options traders reported by CoinDesk are targeting $72,000 by month end, timed to the Federal Reserve meeting.
Key Numbers This Week
| Metric | Value | Change |
|---|---|---|
| BTC Price | $64,527 | 🟢 +0.8% (7d), 🟢 +0.7% (24h) |
| ETH Price | $1,870 | 🟢 +3.6% (7d), 🟢 +1.5% (24h) |
| Fear & Greed Index | 28 (Fear) | — |
| BTC RSI (14) | 54.3 (Neutral) | — |
| BTC Dominance | 56.5% | — |
| CryptoEngine Signal | LONG | — |
How the Signal Has Performed
The most recent completed signal was a LONG that fired July 1, 2026 at $60,415. BTC climbed from there through early July, and the signal returned +4.7% at 3 days, +6.5% at 5 days, and +6.7% at 10 days. That was a clean trend follow. Fear was still in the low 20s when that signal fired, deep in fear territory. The algorithm read the structure correctly: selling pressure had peaked before the signal printed.
Before the July 1 LONG, the system ran a sequence of SHORT signals. The June 24 SHORT returned +4.3%, the June 28 SHORT returned +1.1%, and a brief June 30 SHORT returned +0.1%. Three shorts, all correct. The model was calling the downtrend while price was still above $59,000, then flipped LONG when the structure reversed. Win rate across the last 10 completed signals at 5 days: 10/10.
The current position is the July 14 LONG at $64,829. The reason logged: "Uptrend breaking above resistance." At 3 days, the return is +0.9% per the server's calculation. BTC has pulled back slightly from the entry to $64,527 — the position is underwater on a raw spot basis but hasn't reached any stop level. The signal is still open.
To follow these calls in real time, CryptoEngine's signal dashboard shows each active and completed trade with entry price, stop, and target.
What Does Fear at 28 Mean Right Now?
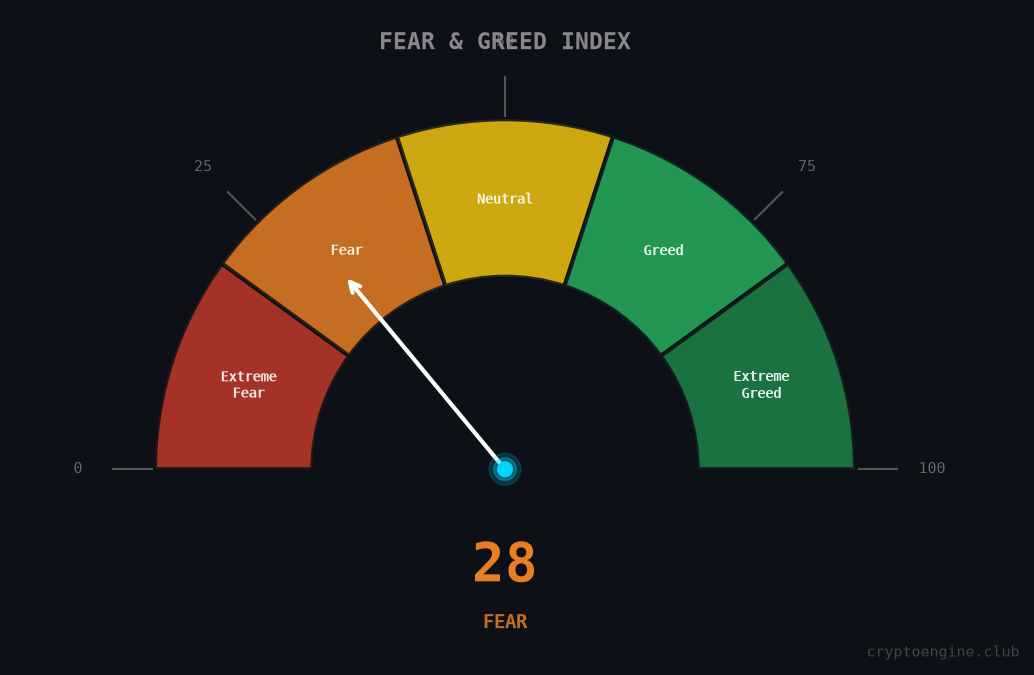
The Fear & Greed Index reads 28 as of July 19. That's Fear — one level above Extreme Fear. The notable part: BTC is trading at $64,500, near the top of its recent range, yet sentiment is still well below neutral.
The Fear & Greed Index is a composite score combining volatility, market momentum, social media volume, surveys, and Bitcoin dominance. A reading of 0 is Extreme Fear; 100 is Extreme Greed. At 28, the reading reflects that retail participants are cautious, not confident.
That gap between price and sentiment is worth paying attention to. When price holds high while fear stays elevated, it typically means selling pressure has dried up. Buyers haven't rushed in yet either. CoinDesk reported this week that large options positions are targeting $72,000 by month end, timed to the upcoming Federal Reserve meeting. If that's where institutional money is positioned, the retail fear reading looks like the lagging indicator here.
Is BTC's RSI at 54 a Green Flag?
BTC's 14-day RSI is 54.3 as of July 19. Above the 50 midline, below 70. In a trending market, RSI above 50 means the upward momentum is intact. It's not overbought, which means there's no technical reason from momentum alone to expect a reversal.
For context: when the June 24 SHORT signal fired, RSI was declining into the low 40s — the trend was weak. The July 1 LONG signal marked the point where momentum was rebuilding. RSI has since climbed back to 54.3, which is consistent with the structure the current signal is built on.
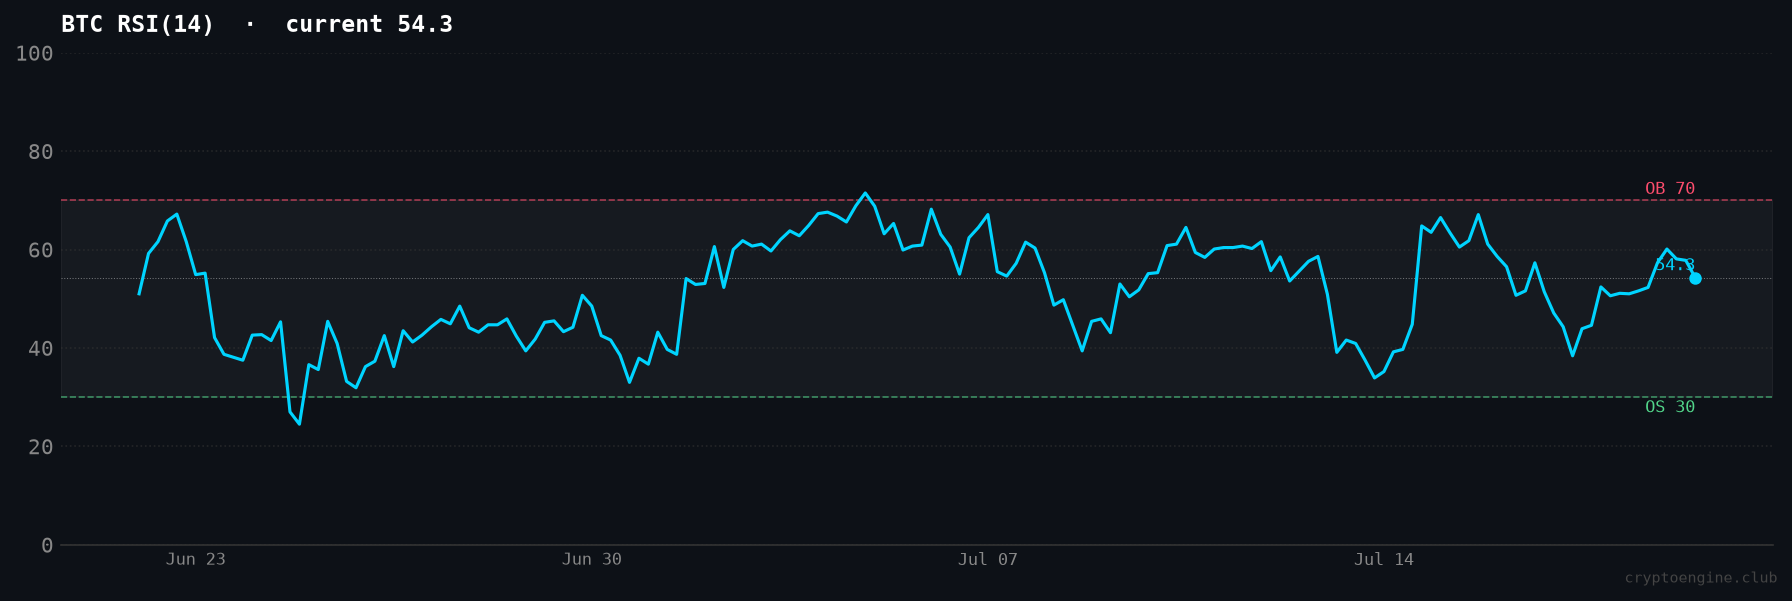
RSI doesn't tell you the signal will work. What it does tell you is that the trend structure supporting the July 14 LONG — momentum has been rebuilt, not exhausted — is still intact at the 3-day mark.
What to Watch Before Next Week's Close
The Fed meeting is the near-term catalyst. Options traders have placed large call spreads targeting $72,000 by month end, per CoinDesk's reporting. If the Fed signals a pause or softens its tone on rates, that typically gives risk assets room to move. BTC at $64,500 with an active LONG is set up for that scenario.
BTC dominance at 56.5% is the other number to track. When dominance holds at this level, bitcoin is leading the market rather than altcoins. Capital is staying in BTC, not rotating out, and that's consistent with the current LONG setup.
The signal is LONG. Fear is at 28. RSI hasn't hit overbought. The position is 3 days old. Next week's close will either extend this signal toward the $72,000 options targets or force a reassessment if BTC loses key support. Check back for the next bitcoin signal recap on July 26.
Frequently Asked Questions
What does this week's bitcoin signal recap show? This bitcoin signal recap shows CryptoEngine's active LONG, which fired on July 14 at $64,829. The system's 3-day return reads +0.9%. BTC currently trades at $64,527. No exit trigger has fired.
What does Fear & Greed at 28 mean for bitcoin? A reading of 28 puts bitcoin in Fear territory on the 0-to-100 Fear & Greed scale. The notable context is that BTC is trading near range highs while sentiment remains depressed. That divergence (price holding while fear stays elevated) often precedes a sentiment catch-up in either direction.
What is BTC's RSI telling us this week? BTC's 14-day RSI is 54.3 as of July 19, 2026. It's above the 50 midline (momentum is positive) but well below the 70 overbought level. RSI at 54 after rebuilding from the low-40s range in late June is consistent with a trend that has reset without being overextended.
How has CryptoEngine's signal performed recently? The most recent completed signal, a LONG from July 1, returned +6.5% in 5 trading days and +6.7% in 10 days. Prior to that, the June 24 SHORT returned +4.3%. The system is 10/10 correct at the 5-day mark across its last 10 completed signals.
Why are options markets targeting $72,000 for bitcoin by end of July? CoinDesk reported large bitcoin call spread positions targeting $72,000 by month end, timed to the upcoming Federal Reserve meeting. If the Fed signals rate cuts or a pause, risk assets including bitcoin typically benefit. A move from $64,500 to $72,000 would require roughly 11.6% upside in under two weeks. That is plausible in a high-volatility environment but not guaranteed.
Disclaimer: This article is for educational purposes only and does not constitute financial advice. Past performance does not guarantee future results. Always do your own research before making trading decisions.
Market data via CoinGecko. News sources: CoinDesk, The Block.