Bitcoin at $64,129, Fear at 23: June 21 Recap | Crypto Engine Research
CryptoEngine's June 18 SHORT entered at $62,823 is up 0.8% at 3 days, with BTC at $64,129. Fear & Greed reads 23 (Extreme Fear). Win rate: 10/10 over the last 10 completed signals (5d).
Bitcoin at $64,129, Fear at 23: June 21 Recap
Bitcoin is barely moving. This BTC signal recap covers June 21, 2026: BTC up 0.2% over seven days, trading at $64,129. Sentiment meanwhile has collapsed to 23 on the Fear & Greed Index, deep in Extreme Fear territory, while RSI holds neutral at 52.6. Crushed sentiment, flat price, no momentum edge in either direction — that's an odd combination that doesn't resolve cleanly into a bull or bear read.
CryptoEngine's active signal is SHORT, entered June 18 at $62,823. Through 3 days the server-reported return is up 0.8%, with BTC now at $64,129.
TL;DR
- CryptoEngine's June 18 SHORT entered at $62,823 has a 3d return of +0.8% as of June 21, 2026.
- BTC trades at $64,129, up 0.2% over the past 7 days and down 16.4% over 30 days.
- The Fear & Greed Index reads 23 (Extreme Fear) while RSI holds neutral at 52.6.
- The last 10 completed signals show a 10/10 win rate on a 5-day horizon.
- BTC dominance stands at 56.3%, with ETH up 3.8% over the past 7 days.
Key Numbers This Week
| Metric | Value | Change |
|---|---|---|
| BTC Price | $64,129 | 🟢 +0.3% (24h), 🟢 +0.2% (7d) |
| ETH Price | $1,726 | 🔴 -0.3% (24h), 🟢 +3.8% (7d) |
| Fear & Greed Index | 23 (Extreme Fear) | — |
| BTC RSI(14) | 52.6 (Neutral) | — |
| BTC Dominance | 56.3% | — |
| Total Market Cap | $2.29T | 🟢 +0.2% (24h) |
| CryptoEngine Signal | SHORT | — |
How the signal has performed
The most recent completed signal was a LONG that fired June 8. Over 5 days it returned +1.6%, extending to +6.0% by day 10. BTC was climbing off a base, and the LONG caught it early.
On June 18 the signal flipped to SHORT. Reason: "uptrend falling below support." Through 3 days the server reports a return of +0.8%. BTC is currently at $64,129, which is 2.1% above the $62,823 entry. Price has moved back above where the SHORT was triggered, and that's working against the position. The early 3d return captured the initial move; where things stand now is less favorable.
No exit has triggered as of June 21.
The track record across the last 10 completed signals (5d): 10 correct calls out of 10. That streak doesn't make any single trade automatic. The current SHORT is a live example of a position moving against you early. The question is whether the failed-support thesis holds as the week progresses.
Want to see each entry and exit logged in real time? CryptoEngine tracks the full signal history here.
What does Extreme Fear at 23 mean for Bitcoin right now?
The Fear & Greed Index reads 23 (Extreme Fear) as of June 21, 2026. Readings below 25 mean the majority of participants are in risk-off mode: selling or sitting out, not chasing.
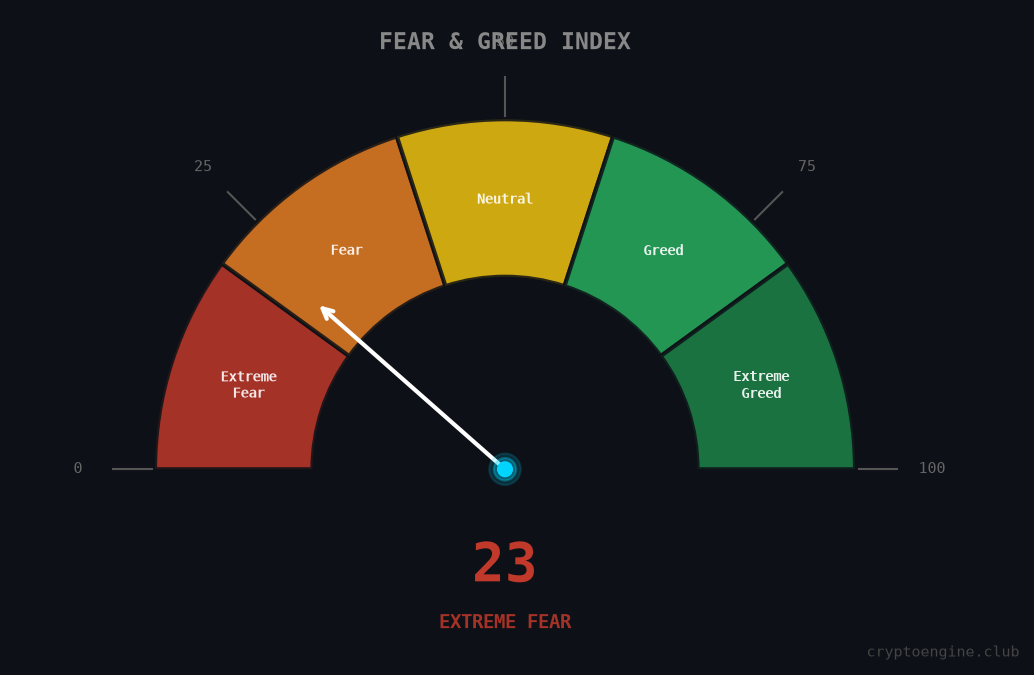
Fear is at panic levels but price is flat. BTC is down 16.4% over 30 days, which explains the fear reading. Over 7 days it's up 0.2%. The sell-off has stalled, at least for now.
Extreme Fear can come before a recovery. It can also come before the next leg down. The index doesn't tell you which, and you shouldn't expect it to. What it tells you is that emotional selling is running the room right now, and that tends to be a bad time to trade impulsively in either direction.
Is the RSI signaling a reversal?
Not yet. BTC RSI(14) reads 52.6 as of June 21, sitting squarely in neutral territory.
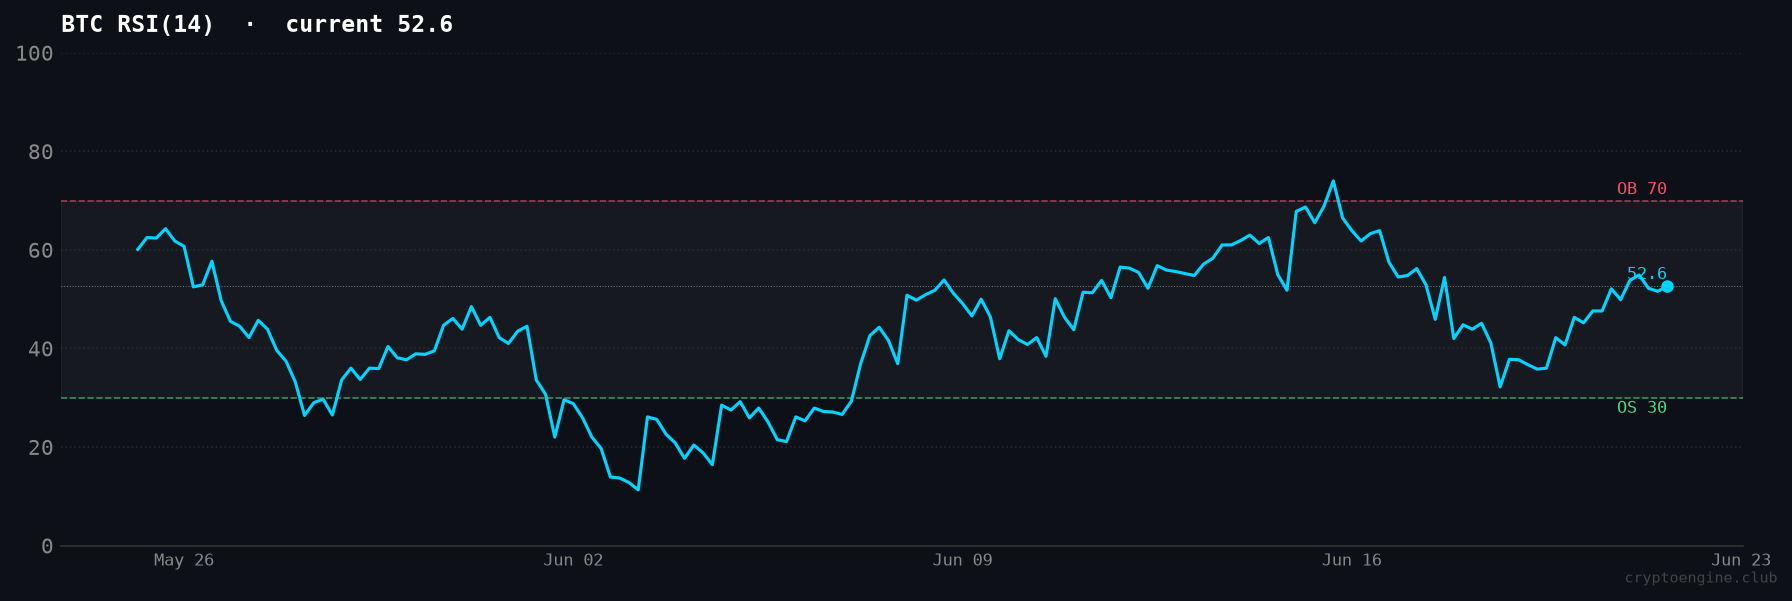
RSI is oversold below 30 and overbought above 70. At 52.6 there's no directional edge from momentum. Neutral RSI with Extreme Fear sentiment is a data conflict: fear says sellers are in control, momentum says neither side has pushed through. When indicators diverge like this, gut trades get expensive. The CryptoEngine signal is SHORT here, built on a structural read (failed support) rather than a sentiment call. RSI at 52.6 doesn't change that read.
What happened in the broader market this week?
ETH gained 3.8% over 7 days while BTC moved just 0.2%. Some rotation into alts, but BTC dominance held at 56.3%. No broad alt season forming yet.
Strategy's preferred stock (STRC) collapsed after leverage liquidations. A major MEV bot got drained of $7.5 million in an ironic counter-exploit. Neither moved BTC meaningfully.
Geopolitical noise: renewed Hormuz strait tensions clouded US-Iran ceasefire talks. BTC held $64,000 through all of it. In past risk-off episodes BTC has sold off faster, so holding a range while fear reads 23 suggests the market may have already priced in more pain than the headlines imply.
What should you watch this week?
Two price levels matter most. Whether BTC holds above $62,823 (the SHORT entry) or drops back toward it: a move below re-validates the thesis. And whether price can clear $64,129 and hold there, which would put real pressure on the open position.
Beyond price: watch whether Fear & Greed recovers above 30 while RSI stays neutral. That combination would signal emotional selling has faded without momentum chasing it higher yet. The 30-day trend is still -16.4%. Weekly flatness doesn't erase that.
CryptoEngine's 10/10 record over the last 10 signals shows what a structured approach looks like in practice. It doesn't protect from early drawdowns, but the calls have been directionally right when measured at 5 days. See the BTC signal recap history and subscribe.
Frequently Asked Questions
What is the CryptoEngine signal for Bitcoin right now? As of June 21, 2026, CryptoEngine's active signal is SHORT, entered June 18 at $62,823. The server-reported 3d return is +0.8%. BTC currently trades at $64,129, above the entry price, with no exit triggered as of this writing.
What does a Fear & Greed Index reading of 23 mean? A reading of 23 puts the Fear & Greed Index in Extreme Fear territory (the range from 0 to 24). It signals that most market participants are fearful, typically following a significant price correction. Extreme Fear has historically appeared near market bottoms but has also preceded continued declines. The reading alone is not a trade signal.
Is Bitcoin RSI oversold right now? No. BTC RSI(14) reads 52.6 as of June 21, 2026, which is neutral. RSI is oversold below 30 and overbought above 70. The current reading shows no strong momentum in either direction.
How has the CryptoEngine signal track record looked recently? Over the last 10 completed signals on a 5-day horizon, CryptoEngine has 10 correct calls out of 10. The most recent closed signal was a LONG from June 8 that returned +1.6% at 5 days and +6.0% at 10 days.
Why is BTC down 16.4% over 30 days but flat on the week? The 30-day decline reflects the correction that started in late May 2026. The near-flat 7-day performance (+0.2%) suggests the selling has paused, not reversed. Whether this is consolidation or a base for recovery is not confirmed by current price action.
Disclaimer: This article is for educational purposes only and does not constitute financial advice. Past performance does not guarantee future results. Always do your own research before making trading decisions.
Market data via CoinGecko. News sources: CoinDesk, Decrypt, The Block.