Bitcoin at $62,102, Extreme Fear at 12: June 8 Recap | Crypto Engine Research
CryptoEngine's June 2 SHORT entered at $66,316 is up 10.5% as BTC drops to $62,102, off 15.5% for the week. Fear and Greed reads 12 (Extreme Fear). Bitcoin erased all post-election gains in its worst weekly slide since FTX.
Bitcoin at $62,102, Extreme Fear at 12: June 8 Recap | Crypto Engine Research
In this BTC signal recap June 2026: CryptoEngine fired a SHORT on June 2 at $66,316. That signal is up 10.5% as of June 7 as BTC shed 15.5% this week, erasing every gain since the November 2024 election. BTC sits at $62,102 with Fear & Greed at 12 — the deepest Extreme Fear reading this cycle.
TL;DR
- CryptoEngine's June 2 SHORT at $66,316 is up 10.5% as of June 8.
- Bitcoin fell 15.5% over seven days to $62,102, its worst weekly loss since the FTX collapse in November 2022.
- Fear & Greed reads 12 (Extreme Fear), the lowest reading this cycle.
- BTC RSI(14) sits at 41.5, neutral territory, not yet oversold.
- 10 of the last 10 CryptoEngine signals returned positive over a 5-day window.
Key Numbers This Week
| Metric | Value | Change |
|---|---|---|
| BTC Price | $62,102 | 🔴 -15.5% (7d), 🟢 +2.2% (24h) |
| ETH Price | $1,627 | 🔴 -18.9% (7d) |
| Fear & Greed | 12 (Extreme Fear) | — |
| BTC RSI(14) | 41.5 | — |
| BTC Dominance | 56.1% | — |
| Total Market Cap | $2.23T | 🟢 +3.2% (24h) |
| CryptoEngine Signal | SHORT | — |
What happened to Bitcoin this week?
The short version: $390 billion gone in seven days. CoinDesk called it the worst weekly rout since FTX collapsed in November 2022. Bitcoin has now given back everything it gained after the election, and then some.
Analysts at NYDIG put out a note saying there's no single cause. They listed AI sentiment shifts, tech IPOs pulling capital away from risk assets, quantum computing concerns, and Strategy's ongoing bitcoin sales all as simultaneous factors. That kind of scattered explanation usually means the market didn't have one good reason to sell; it had ten OK reasons, which is sometimes worse.
Ethereum dropped 18.9% to $1,627 on the week. Total market cap sits at $2.23T after a brief 3.2% bounce on June 7.
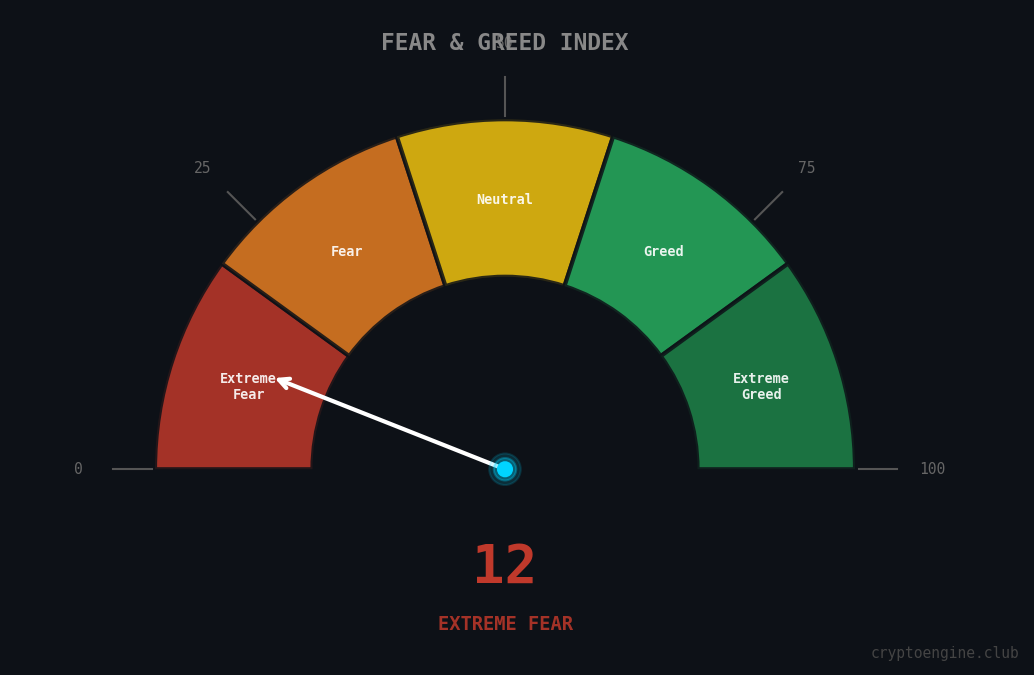
As the gauge above shows, the Fear & Greed Index read 12 on June 7, about as low as it gets in a functioning market. BTC dominance held at 56.1%. In past capitulation events, dominance usually spikes as traders flee altcoins for BTC. The fact it's relatively stable suggests the selling is broad rather than a rotation.
How has the CryptoEngine signal performed?
CryptoEngine's current signal is SHORT, fired June 2 at $66,316, with the model citing a "downtrend falling below support." As of June 7, BTC is at $62,102. The 3-day return on the signal is +10.5%.
The most recent completed signal before that was a SHORT from May 28 at $73,370, which returned +9.6% on a 5-day basis. That one caught the bulk of the move from the $73k range down into the mid-$60s.
Before the May 28 SHORT, there was a LONG on May 25 at $77,093. It returned just +0.4% over 5 days, technically in the win column but a near-miss. BTC failed to hold the recovery setup and reversed sharply into a new SHORT two days later.
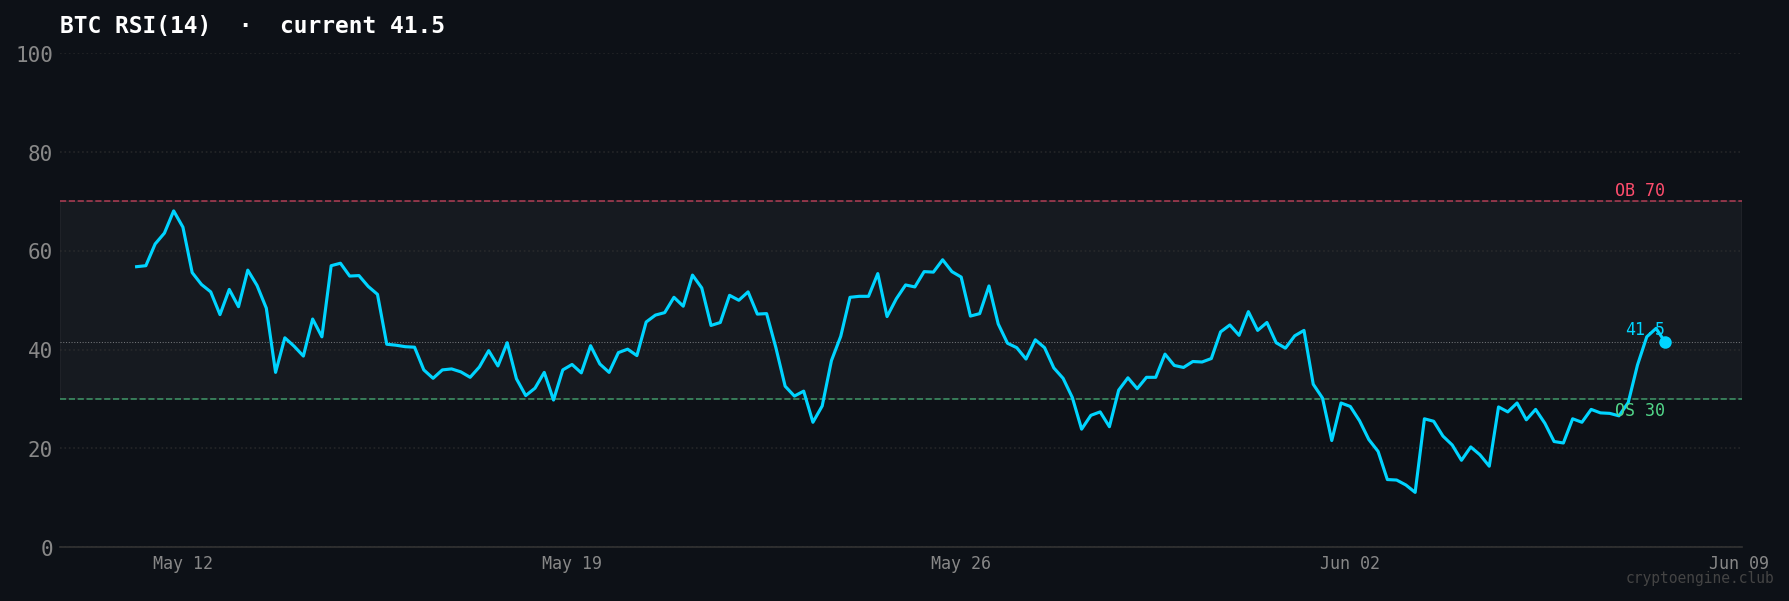
BTC RSI(14) reads 41.5 as shown above, neutral and not yet in oversold territory. The chart shows momentum still trending downward even with the June 7 bounce (+2.2% on the day). A single-day uptick at RSI 41 is not a reversal signal.
The 5-day win rate is 10 of the last 10. Even with the May 25 LONG producing a whisker-thin positive, the recent run has been unusually consistent on direction calls.
Want to track the active signal in real time? CryptoEngine's signal feed posts entry, stop, and target levels for every trade.
What is extreme fear telling us right now?
The Fear & Greed Index aggregates six inputs: market volatility, price momentum, social media sentiment, survey results, BTC dominance, and Google search trends. On a 0-to-100 scale, 12 means nearly every one of those components is pointing toward fear right now.
Readings below 15 have tended to coincide with short-to-medium-term price bottoms. When everyone who wants to panic-sell has already sold, the remaining supply is largely in stronger hands. That's the theory, anyway.
That logic holds less cleanly when macro outflows are involved. The current drop has global risk-off dynamics behind it: tech IPO capital rotation, AI-driven sentiment, institutional rebalancing. Those forces don't reset just because crypto sentiment hits a floor.
RSI at 41.5 muddies the picture. The oversold threshold is around 30. We're not there yet. Sentiment is extreme, but price momentum hasn't hit its floor. That gap between a terror-level fear reading and a neutral RSI is uncomfortable to trade into from either direction.
What should BTC traders watch next week?
BTC briefly traded near $60,165 on June 6 before recovering to $62,102. If selling resumes, $60,000 is the level to watch. It's a round number that tends to attract both limit buyers and stop-loss triggers in clusters.
RSI below 30 is the other thing worth tracking. That's where price momentum exhaustion tends to line up with the sentiment reading, and those two-signal setups have historically produced the cleanest short-term bounces.
The CryptoEngine SHORT is still active. No exit trigger has fired. Until the model reads a structural shift, the signal stays SHORT.
Frequently Asked Questions
What is CryptoEngine's current BTC signal? CryptoEngine's active signal is SHORT, fired June 2, 2026, at an entry price of $66,316. As of June 7, BTC trades at $62,102, down 6.4% from entry. The signal's 3-day return is +10.5%.
Why did Bitcoin drop so hard this week? NYDIG analysts cited no single cause. AI-driven market sentiment shifts, tech IPO capital rotation, quantum computing concerns, and ongoing bitcoin sales by Strategy (formerly MicroStrategy) all contributed simultaneously. The $390 billion market cap loss in one week was the worst since the FTX collapse in November 2022.
What does a Fear and Greed Index reading of 12 mean? It means almost everyone who could panic has already panicked. The index aggregates volatility, momentum, social sentiment, BTC dominance, and search trends on a 0-100 scale; 12 is near the floor. Readings below 15 have lined up with short-to-medium-term price bottoms before, though sentiment alone won't tell you when the bounce comes.
Is BTC RSI oversold right now? No. As of June 7, RSI(14) reads 41.5, neutral territory. Oversold is below 30. The current reading shows momentum still trending down; the June 7 bounce didn't change the slope meaningfully.
What is the win rate in this BTC signal recap June 2026? 10 of the last 10 signals returned positive over a 5-day window. The most recent completed one was a SHORT from May 28 at $73,370, which returned +9.6% over 5 days. The May 25 LONG at $77,093 technically returned +0.4%, barely positive. Past performance does not guarantee future results.
Disclaimer: This article is for educational purposes only and does not constitute financial advice. Past performance does not guarantee future results. Always do your own research before making trading decisions.
Market data via CoinGecko. News sources: CoinDesk, Decrypt, The Block.