BTC at $66K, fear & greed hits 9: March 29 signal recap
BTC fell 3.3% this week to $66,461 as the Fear & Greed Index hit 9 (Extreme Fear) and RSI(14) sits at 40.7. When panic peaks and momentum stays neutral, the setup that follows tends to be the one worth trading.
BTC at $66K, fear & greed hits 9: March 29 signal recap
Bitcoin closed the week at $66,461, down 3.3% over seven days. The Fear & Greed Index hit 9. That's Extreme Fear, one of the lowest readings in recent memory. RSI(14) sits at 40.7: below the midpoint of 50, leaning bearish, but not at oversold levels yet. Two very different signals pointing in opposite directions. Here's what they mean together.
TL;DR
- BTC is down 3.3% this week, trading at $66,461 as of March 29, 2026.
- The Fear & Greed Index reads 9 (Extreme Fear), near the bottom of the sentiment scale.
- BTC RSI(14) is at 40.7, sitting in neutral territory despite the fear spike.
- BTC dominance climbed to 56.1%, as capital rotates out of altcoins into Bitcoin.
- Total crypto market cap stands at $2.37T, down 0.9% in 24 hours.
Key numbers this week
| Metric | Value | Change |
|---|---|---|
| BTC Price | $66,461 | 🔴 -3.3% (7d), 🔴 -0.8% (24h) |
| ETH Price | $1,991 | 🔴 -4.2% (7d), 🔴 -1.8% (24h) |
| Fear & Greed Index | 9 (Extreme Fear) | — |
| BTC Dominance | 56.1% | — |
| BTC RSI(14) | 40.7 (Neutral) | — |
| Total Market Cap | $2.37T | 🔴 -0.9% (24h) |
What happened to BTC this week?
Seven days of grinding pressure. Bitcoin shed 3.3% and, while $66,000 held, the move felt heavier than the percentage suggests. Ethereum took a harder hit at -4.2% for the week. Smaller caps like Kaspa (-7.9%) and Pudgy Penguins (-5.4%) showed how fast altcoins bleed when BTC stumbles.
BTC dominance at 56.1% tells the story clearly: traders are consolidating into Bitcoin and walking away from risk. When dominance rises as prices fall, it usually means rotation to the perceived "safest" crypto, not new money entering the market.
The total market cap dropped to $2.37T. Not a collapse, but a slow bleed that compounds across portfolios.
What does a Fear & Greed score of 9 actually mean?
That 9 is not just "cautious." A score of 9 means the market is near maximum panic. The Fear & Greed Index runs from 0 (Extreme Fear) to 100 (Extreme Greed), and a reading of 9 puts us close to the floor.
Scores this low are uncommon. They tend to cluster around significant market stress events and can persist for days or weeks before reversing. The real question: is this fear rational, or is it overshooting?
As the gauge below shows, sentiment has hit rock bottom:
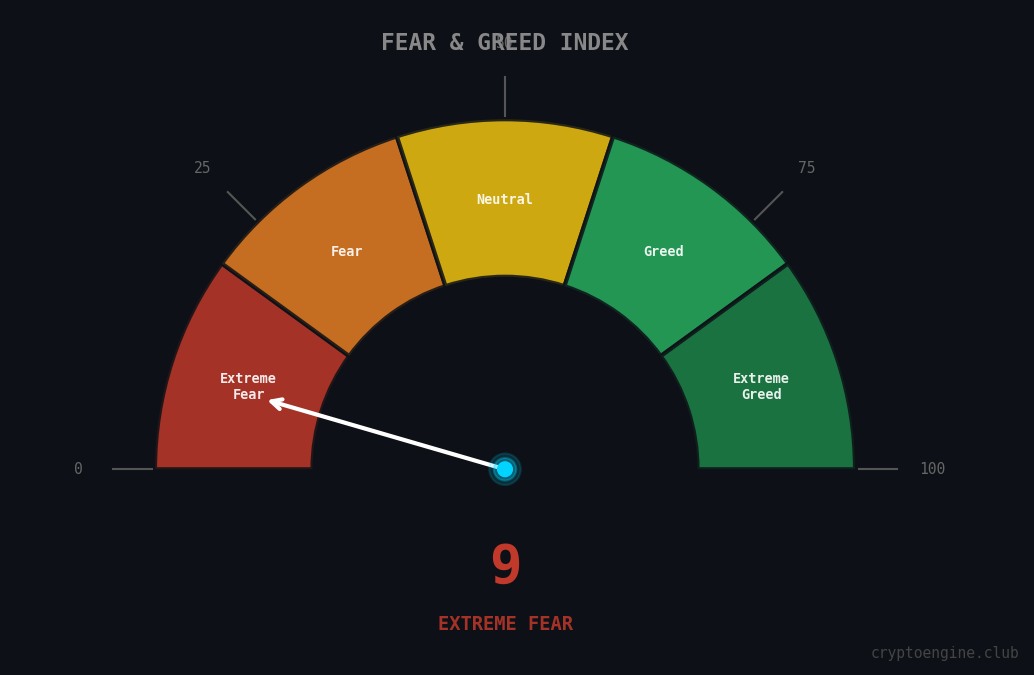
Extreme fear alone is not a buy signal. It tells you panic is real. Whether that panic is justified depends on the technical picture, and that's where RSI comes in.
Is RSI confirming the fear, or diverging from it?
RSI at 40.7 is the interesting part of this week's setup. Sentiment is screaming danger, but momentum isn't confirming it. An RSI of 40.7 is neutral: below 50, leaning bearish, but nowhere near the oversold zone below 30 that has historically preceded BTC bounces.
Two scenarios from here. Either RSI continues sliding toward oversold territory and aligns with the fear reading (a breakdown), or RSI holds and starts turning up while fear stays pinned (a divergence that can precede sharp reversals).
Watch the RSI chart for direction:
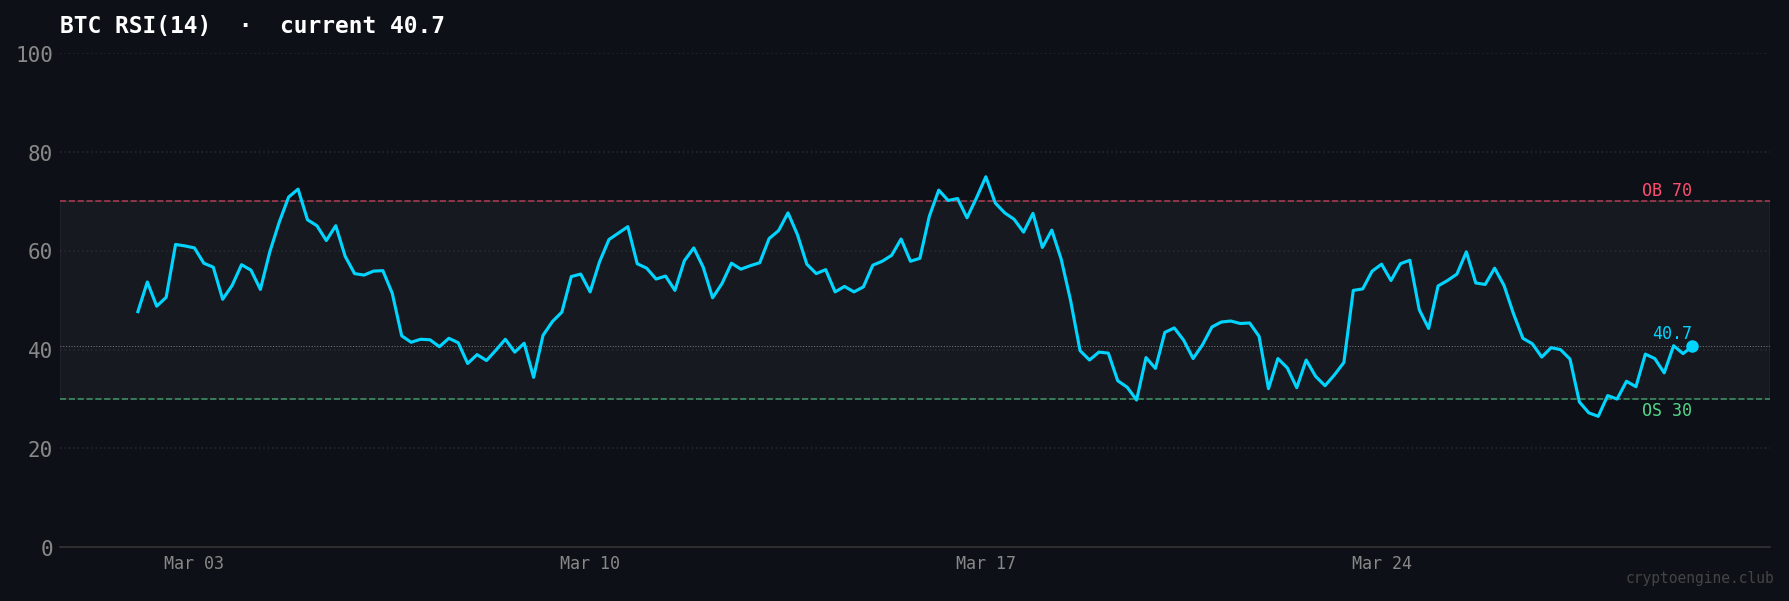
The drop is fear-driven, not momentum-exhausted. Those are different conditions with different implications. Fear-driven selloffs can recover fast when sentiment flips. Momentum breakdowns tend to grind lower.
How CryptoEngine's signals are reading this setup
CryptoEngine's model factors in Fear & Greed, RSI, and BTC dominance together, not each in isolation. Extreme fear, neutral momentum, elevated dominance — it's a market waiting for a catalyst, not a clear entry or exit.
The signals are in a holding pattern. When Fear & Greed sits this low and RSI hasn't confirmed oversold, the model watches for two things: a momentum breakdown (RSI drops below 30) or a sentiment reversal where fear starts recovering before price does (a potential early entry trigger). Jumping in too early in conditions like this is one of the most common mistakes traders make.
If you want to track exactly when CryptoEngine's model fires the next signal, see current signal performance here.
A common mistake in extreme fear markets
The biggest trap right now: treating a Fear & Greed score of 9 as a guaranteed buy signal. Extreme fear has preceded market bottoms before, but it has also preceded continued drawdowns. The score tells you sentiment is low, not that it can't go lower.
Traders who buy solely on fear readings without waiting for RSI confirmation often catch a falling knife. CryptoEngine's model requires both conditions before issuing an entry signal, not just one. That filter exists for exactly this kind of environment.
What to watch heading into next week
BTC dominance at 56.1% is the first thing to monitor. If it keeps climbing, altcoins will keep bleeding. A reversal in dominance is often one of the earlier signs that risk appetite is coming back.
The Fear & Greed Index needs to lift off 9. A reading this low rarely persists indefinitely, but direction and speed of recovery both matter. A slow grind from 9 to 20-30 is healthier than a sudden spike back to 40 (which sometimes precedes another leg down, not a bottom).
RSI at 40.7 is the number to watch. Does it hold above 35, or does it crack toward 30? Nobody knows if $66,000 is the floor. But this is exactly the kind of setup where patience beats conviction.
Frequently asked questions
What is the Fear & Greed Index and what does a score of 9 mean? The Fear & Greed Index measures crypto market sentiment on a scale from 0 (Extreme Fear) to 100 (Extreme Greed). A score of 9 is near the bottom of the range, indicating widespread panic. Scores this low are uncommon and tend to appear during significant stress events or near cycle lows.
Is BTC a buy when Fear & Greed is at extreme fear? Extreme fear can signal a potential buying opportunity, but only when confirmed by other indicators. RSI dropping into oversold territory (below 30) alongside extreme fear creates a stronger setup than fear alone. BTC's RSI is at 40.7 right now — the technical picture hasn't confirmed the fear yet. Waiting for that confirmation is the lower-risk approach.
What does BTC dominance of 56.1% mean for altcoins? BTC dominance is the share of total crypto market cap held in Bitcoin. At 56.1%, Bitcoin holds more than half of all crypto value — typically a risk-off signal. When dominance rises during a price decline, altcoins usually fall harder than BTC, which is exactly what happened this week: ETH down 4.2% vs BTC's 3.3%.
Why is ETH down more than BTC this week? Ethereum fell 4.2% versus BTC's 3.3%, consistent with the altcoin underperformance pattern when BTC dominance climbs. In defensive markets, capital concentrates in Bitcoin first. ETH and smaller caps absorb more of the downside.
What BTC signals should traders watch right now? The combination of extreme fear (9) and neutral RSI (40.7) suggests the market hasn't fully capitulated yet. Watch for RSI dropping toward 30 for a potential long setup, or a failure to hold $66,000 support as a risk signal. CryptoEngine's model tracks these exact thresholds and sends alerts when the conditions align.
Disclaimer: This article is for educational purposes only and does not constitute financial advice. Past performance does not guarantee future results. Always do your own research before making trading decisions.
Market data via CoinGecko. News sources: CoinDesk, The Block, Decrypt.