Bitcoin at $76,750, Fear at 34: May 26 Signal Recap | Crypto Engine Research
CryptoEngine's May 25 LONG entered at $77,093 and is down 0.44% with BTC at $76,750. The prior SHORT nailed a 3.3% peak drop from $78,156. Fear and Greed reads 34 (Fear), RSI 52.9 (Neutral). The LONG needs BTC above $77,093 to confirm the breakout.
This BTC signal recap covers the week ending May 26, 2026. The headline looks quiet: BTC is down just 0.1% over seven days. But the SHORT closed green, a new LONG fired, and Bitcoin's spot demand quietly dropped to its worst level since December. Flat price, shifting signals.
TL;DR
- CryptoEngine's May 16 SHORT entered at $78,156 and returned +2.5% (5d), +4.7% (10d). BTC hit $75,548 at peak on May 23.
- CryptoEngine's last 10 completed signals are 10/10 correct at the 5-day mark.
- The new LONG signal entered at $77,093 on May 25; BTC trades at $76,750, putting the signal down 0.44% from entry as of May 26.
- BTC's Fear and Greed Index reads 34 (Fear) and RSI is at 52.9 (Neutral) as of May 26, 2026.
- Bitcoin ETFs shed $112 million in a single session as equities rallied on Iran peace news while BTC held sideways.
Key Numbers This Week
| Metric | Value | Change |
|---|---|---|
| BTC Price | $76,750 | 🔴 -1.2% (24h), 🔴 -0.1% (7d) |
| Fear & Greed Index | 34 (Fear) | — |
| BTC RSI(14) | 52.9 (Neutral) | — |
| BTC Dominance | 58.1% | — |
| Total Market Cap | $2.65T | 🔴 -1.0% (24h) |
| CryptoEngine Signal | LONG | — |
How last week's SHORT signal played out
The May 16 SHORT fired at $78,156 when BTC was falling below support. That read was correct.
BTC dropped from $78,156 to a low of $75,548 on May 23. The server-computed 5-day return: +2.5%, extending to +4.7% over 10 days. The signal closed on May 25 when the algorithm flipped to LONG at $77,093.
That's consistent with CryptoEngine's recent track record: 10/10 correct across the last 10 completed signals (5d). The directional calls have been right.
Fear and Greed sat in the low 30s throughout, RSI between 48 and 54. No strong momentum either way — which actually helped the SHORT. Without buyers pushing back, price drifted lower on its own weight.
Verdict: Correct. +2.5% at day 5, +4.7% at day 10.
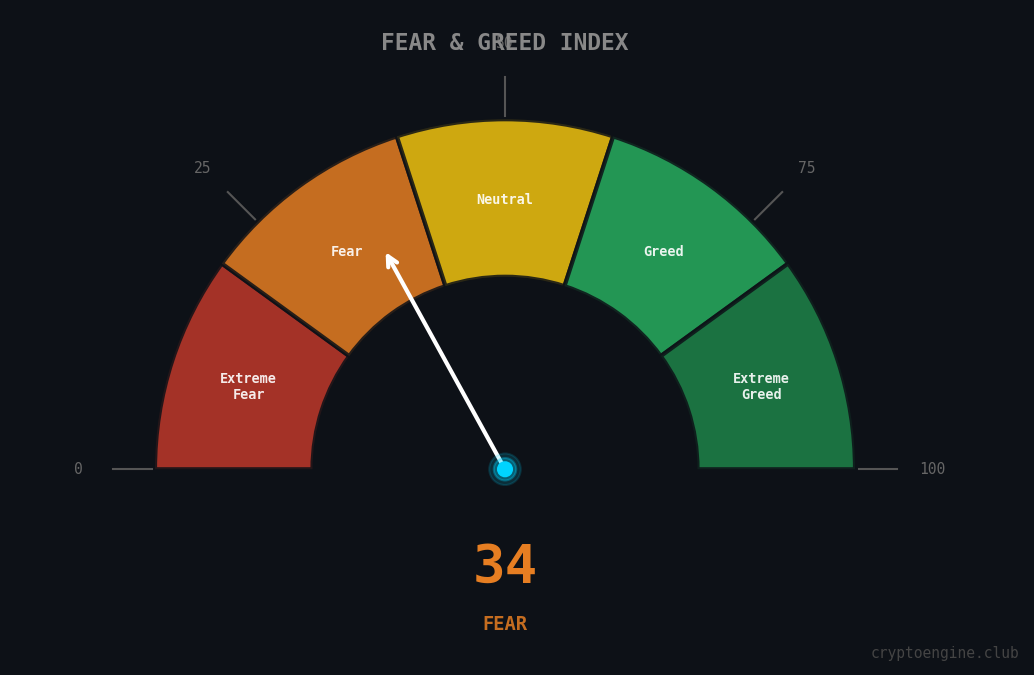
The Fear and Greed Index at 34 is a mild positive for the LONG setup. Fear readings don't guarantee bottoms, but they do mean most retail traders are already nervous, which usually means the heaviest selling has already happened. Extreme fear (below 20) would be more convincing, but 34 beats neutral or greedy.
What does the RSI tell us about BTC right now?
RSI(14) at 52.9 is the middle of the road.
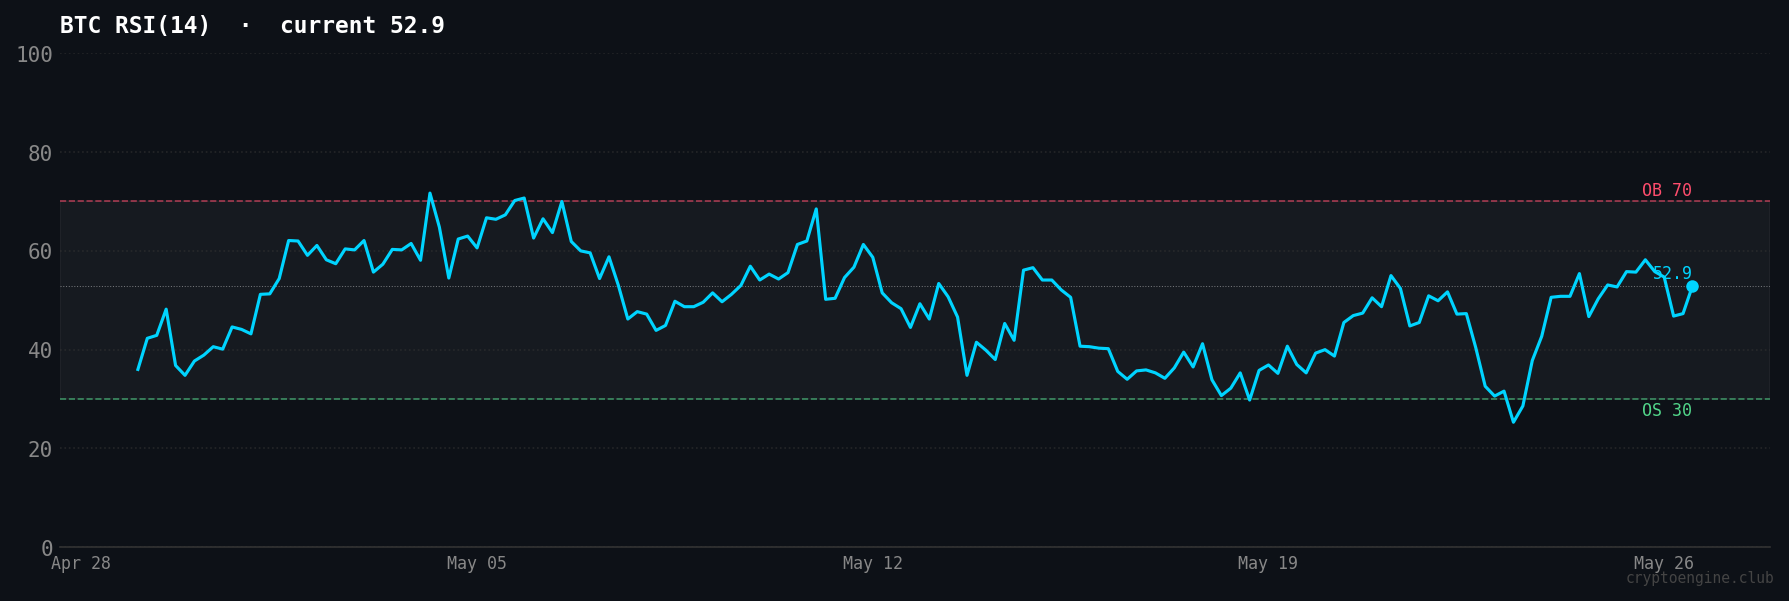
RSI under 70 means you're not chasing an overbought market. RSI above 30 means you're not picking up a deeply oversold setup either. At 52.9 there's no directional edge from momentum alone. The LONG's success depends more on news flow and spot demand than on RSI setups.
For the active signal, this is fine. The entry came while RSI was neutral, not chasing a trend. What you want to see is RSI climbing toward 60-65 as BTC follows through above $77,093. If RSI rolls back below 50 while price stays under entry, that's an early warning the breakout isn't happening.
What's driving BTC's sideways action this week?
Equities rallied Monday on Iran peace deal reports, but BTC didn't follow. When stocks run and crypto holds flat, it usually means buyers are exhausted.
This week it looks like they are. Bitcoin's demand gauge fell to its worst level since December, with spot buying running thin. ETFs shed $112 million in a single session. Strategy slashed its cash reserves by 61% to retire $1.5 billion in convertible debt, a sign that institutional holders are managing leverage rather than adding. Strive acquired 1,109 BTC to bring their total to 16,500 coins, a consistent corporate buyer but nowhere near enough volume to move the market.
No panic, no conviction. BTC needs either a demand shock or an ETF flow reversal to break out of this range.
What should traders watch this week?
Two price levels matter most in this BTC signal recap.
The LONG signal entered at $77,093. BTC needs to reclaim and hold above that level to confirm the breakout premise. Below, the May 23 low of $75,548 is the support to watch. A close below that puts the thesis under real pressure.
RSI is the directional tell. If it climbs through 55-60 while BTC is above $77,000, the setup looks healthy. A rollover back below 50 while price sits under entry is the cleaner reason to reconsider.
Want the exact entry, stop-loss, and take-profit levels for each signal without running the numbers yourself? CryptoEngine delivers the full trade plan with every new signal. Plans start at $8.25/month.
Frequently Asked Questions
What happened to last week's SHORT signal? The May 16 SHORT entered at $78,156.22 when BTC was falling below support. It returned +2.5% over 5 days and +4.7% over 10 days (server-computed). BTC hit a low of $75,548 on May 23 before the signal closed on May 25 when the algorithm flipped to LONG.
What does a Fear and Greed reading of 34 mean for Bitcoin? A reading of 34 places Bitcoin in "Fear" territory on the 0-100 scale. Retail sentiment is cautious but not panicked. Historically, Fear readings tend to appear near market lows or during consolidation phases, not during strong uptrends.
Why didn't Bitcoin rally when equities surged on Iran peace news? Bitcoin's demand gauge dropped to its worst level since December and ETFs shed $112 million in one session. Thin spot buying means BTC lacks the buyer depth to follow equity moves, even when risk-on sentiment picks up elsewhere.
Disclaimer: This article is for educational purposes only and does not constitute financial advice. Past performance does not guarantee future results. Always do your own research before making trading decisions.
Market data via CoinGecko. News sources: CoinDesk, Decrypt, The Block.