Bitcoin at $77,105, Greed at 61: September 13 Recap | Crypto Engine Research
CryptoEngine's SHORT signal, active since Sept 10 at entry price $76,818, is up 0.3% as BTC holds $77,105. RSI has dropped to 36.3 despite Fear and Greed reading 61. Ten consecutive 5-day signals have been correct. The RSI-sentiment split is this week's key watchpoint.
Bitcoin at $77,105, Greed at 61: September 13 Recap | Crypto Engine Research
Bitcoin is down 3.3% this week to $77,105, pulling back from a 23.4% monthly run while the Fear & Greed Index holds steady at 61. The interesting data point isn't the price, though. RSI has dropped to 36.3, a reading near the low end of neutral and uncomfortably close to the oversold threshold, while sentiment looks anything but fearful. That gap between momentum and crowd psychology is the week's defining tension.
A bitcoin market recap is a weekly snapshot of price action, sentiment, and signal performance. This bitcoin market recap September 13 2026 focuses on a week where RSI and crowd sentiment split sharply.
TL;DR
- CryptoEngine's SHORT signal, active since September 10 at $76,818, shows a +0.3% return over 3 trading days.
- BTC trades at $77,105 as of September 13, down 3.3% for the week but up 23.4% over 30 days.
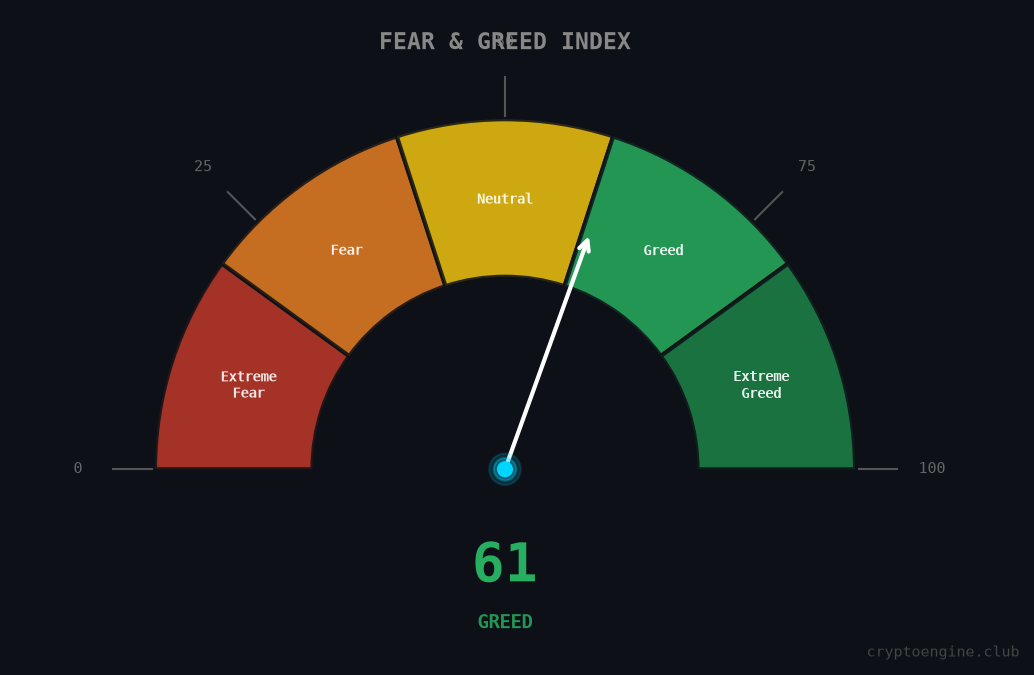
- The Fear & Greed Index reads 61 (Greed) while RSI(14) sits at 36.3, near the lower bound of neutral.
- CryptoQuant analysts say BTC needs to clear $81,700 to confirm a new bull market phase.
- CryptoEngine has logged 10 consecutive correct 5-day signals.
| Metric | Value | Change |
|---|---|---|
| BTC Price | $77,105 | 🔴 -3.3% (7d), 🔴 -0.4% (24h) |
| Fear & Greed | 61 (Greed) | — |
| BTC RSI(14) | 36.3 | — |
| BTC Dominance | 58.9% | — |
| ETH Price | $2,486 | 🔴 -0.1% (7d) |
| CryptoEngine Signal | SHORT | — |
How Has the CryptoEngine Signal Performed This Week?
The most recent completed signal, a SHORT that fired September 7, returned +3.0% over five trading days. The one before it, a SHORT from August 31, returned +2.5% over the same window. Both called downside in a market that looked like it was stabilizing, and both were right.
The active signal is a SHORT opened September 10 at $76,818, following what the model flagged as "uptrend falling below support." Over three days, the signal shows a +0.3% return. BTC has essentially moved sideways since the call, trading in a narrow range around entry.
CryptoEngine has logged 10 consecutive correct 5-day signals. That includes two LONGs in August (the August 19 call returned +14.9% over five days during the rally) and three consecutive SHORTs as BTC faded from that peak. The model has been right about the direction at each inflection. The current SHORT call suggests the pullback from the 23.4% monthly run is not finished.
CryptoEngine has logged every signal publicly since it started tracking; its last 10 completed 5-day signals returned a 100% win rate. See the full signal log.
Why Is RSI at 36 When Sentiment Reads Greedy?
That divergence is worth sitting with. Fear & Greed at 61 says market participants feel confident. RSI at 36.3 says buying momentum has stalled. Not crashed, but noticeably weakened. When sentiment and momentum split like this, one of them typically corrects first.
The 30-day gain of +23.4% explains the sentiment. Traders who bought the August dip are sitting on solid gains and the crowd is still leaning bullish. But RSI at 36 suggests that recent sellers have been absorbing the rally, not chasing it. Price can drift sideways or lower while sentiment stays elevated. Not unusual, but not a green light either.
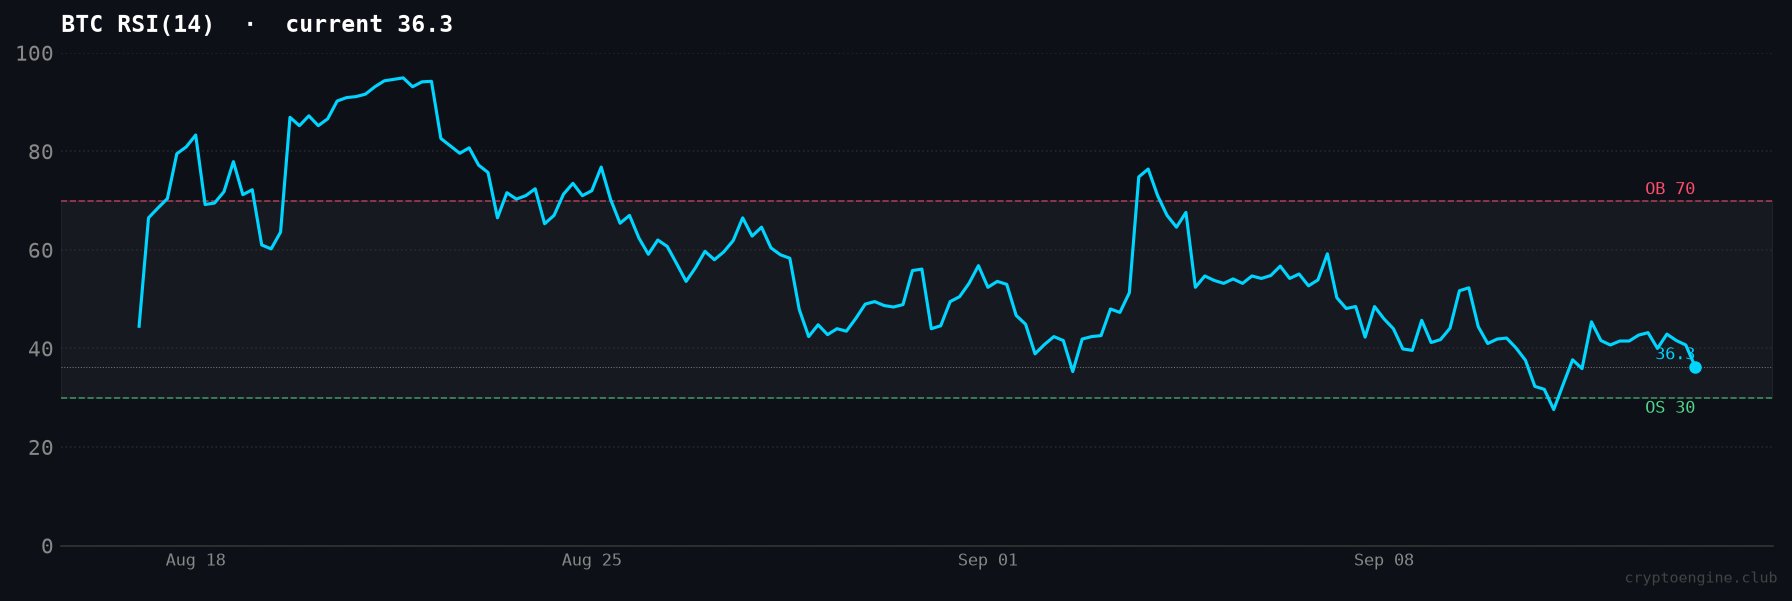
The RSI chart below makes the momentum picture clearer. After the August rally pushed RSI toward the upper range, the reading has dropped steadily through September, matching the 3.3% weekly decline in price.
What Does the $81,700 Level Mean for BTC?
Analysts at The Block reported this week that CryptoQuant says bitcoin must clear $81,700 to confirm a new bull market. BTC is currently trading about 6% below that level. The 23.4% monthly gain is real, but the market still has a specific test ahead of it.
That context matters for reading the current SHORT call. The signal is not predicting a crash. It is flagging that BTC is in a zone where resistance is real and the rally has not been confirmed. In last week's September 7 recap, the SHORT that fired that day returned +3.0% as price failed to hold higher ground. The same dynamic is playing out now, just with smaller initial movement.
What Is Driving Crypto Markets This Week?
A few threads worth tracking this week:
The Fed rate discussion is back. Multiple news stories this week covered rate hike expectations, with one economist arguing the move is about Wall Street more than inflation. Rate decisions hit BTC through the risk-off channel, and the September Fed meeting is the next hard catalyst. The effect of interest rate expectations on BTC pricing is something we covered in depth recently if you want the full framework.
The Clarity Act is in Senate limbo. Regulatory clarity would be a long-term positive for BTC price, but each delay keeps institutional buyers cautious. The uncertainty is baked into the current sideways action.
On Reddit, the dominant theme this week is "Bitcoin Renaissance" combined with conviction that the bottom is already in. "Lambos are temporary, the dip is forever" was among the top posts. That kind of sentiment, where traders call a bull market before price confirms it, is exactly the scenario covered in how to tell if a crypto bull run has started. The $81,700 level sits between current price and what the data says a confirmed bull phase actually looks like.
The Revolut data exposure story also circulated widely — user KYC data and bitcoin transaction histories were reportedly accessed via a fake government request. Unrelated to price action, but worth noting for traders who rely on exchanges for custody.
What Should Traders Watch for Next Week?
Watch $81,700, the bull market confirmation threshold from CryptoQuant. A clear weekly close above it changes the picture entirely. $76,818, the current signal entry price, also acts as a near-term support reference; a move back below it validates the SHORT thesis. If momentum keeps fading and RSI approaches 30, that typically sets up the next LONG entry window.
The current setup is ambiguous but leans cautious. Sentiment is elevated, momentum is weak, and price hasn't confirmed the bull case. The active SHORT fits that picture.
If you want data-driven signals instead of watching charts manually, CryptoEngine's subscription starts at $8.25/month. Every signal includes entry price, stop-loss, and the exact conditions that triggered it.
Frequently Asked Questions
What is CryptoEngine's current BTC signal for September 2026? In this bitcoin market recap September 13 2026, CryptoEngine holds a SHORT signal opened on September 10 at entry price $76,818. The 3-day return stands at +0.3%.
Why is bitcoin down this week when sentiment looks greedy? BTC fell 3.3% this week to $77,105 despite the Fear & Greed Index reading 61 (Greed). The pullback follows a 23.4% monthly gain, and RSI at 36.3 shows buying momentum has weakened. A weekly dip after a strong monthly run is normal. Traders taking profits can push price lower even while broader sentiment stays positive.
What does RSI 36 mean for bitcoin in September 2026? RSI(14) at 36.3 puts BTC in the lower part of the neutral zone, just above the oversold threshold of 30. It means recent price momentum has stalled but has not reversed enough to signal a strong buy setup. Traders using RSI watch for a drop below 30 as a potential entry window.
Is it a good time to buy bitcoin right now? BTC is currently trading about 6% below the $81,700 level that analysts say is needed to confirm a new bull market. The active CryptoEngine signal is SHORT, meaning the model sees more downside risk than upside. That does not mean a buy entry is permanently off the table, but the current data does not support a high-confidence LONG setup.
What happens to bitcoin when the Fed raises rates? Rate hikes typically pressure BTC by increasing the opportunity cost of holding speculative assets. When yields on safer instruments rise, capital tends to rotate out of risk-on assets including crypto. The upcoming Fed meeting is a near-term catalyst for the cautious price action this week.
Disclaimer: This article is for educational purposes only and does not constitute financial advice. Past performance does not guarantee future results. Always do your own research before making trading decisions.
Market data via CoinGecko. News sources: CoinDesk, The Block.