Crypto Fear and Greed Index: What the Data Really Shows
Sentiment extremes mark turning points, but 30-day returns after extreme fear averaged -2.3%. The indicator works better as context than as a standalone buy signal.
Crypto Fear and Greed Index: What a year of data actually shows
The crypto Fear and Greed Index is a daily sentiment score from 0 to 100 that measures how fearful or greedy the market is right now. Zero means maximum fear. One hundred means maximum greed. Most days, the truth sits somewhere between the two extremes. When it doesn't, the data suggests you should pay attention.
Right now, as of March 20, 2026, the index reads 12 (Extreme Fear). Bitcoin is trading at $70,613, roughly flat on the week (-0.3%). That combination of deep fear and sideways price is exactly the kind of environment this index was built to interpret. To do that well, you need to look at the data.
TL;DR
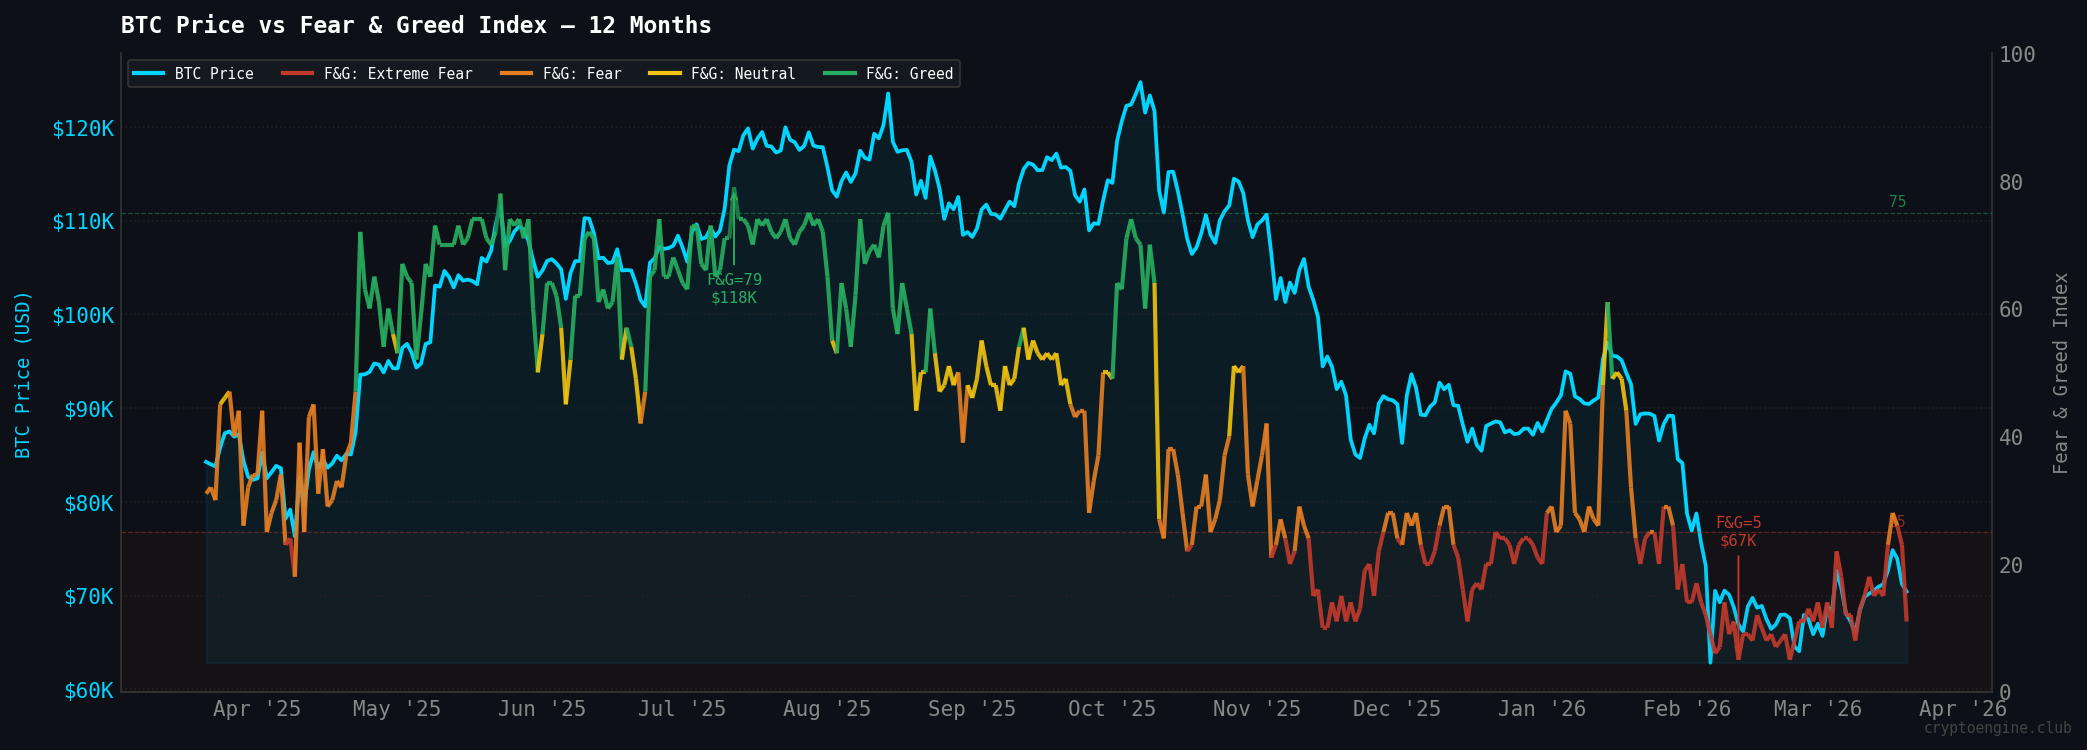
- The Fear & Greed Index hit 5 (Extreme Fear) on Feb 12, 2026. That was BTC's cycle low: $66,938.
- The only Extreme Greed reading last year was 79 on Jul 12, 2025, a week before BTC peaked at $117,571.
- Extreme Fear (F&G ≤ 25) occurred on 113 of the last 365 days, nearly one in three.
- Average 30-day return after extreme fear: -2.3%. The index alone is not a buy signal.
- Right now: F&G=12 with RSI at 44.6 (Neutral). Sentiment is deep in fear while price holds above the February lows.
What is the Fear and Greed Index?
The Fear and Greed Index takes six data inputs (price volatility, market momentum, social media sentiment, Bitcoin dominance, search trends, and spot survey data) and weights them into a single number. At 0–24, the market is in Extreme Fear. At 25–49, it's Fear. Neutral runs from 50 to 54. Greed covers 55–74, and Extreme Greed is 75–100.
The index updates daily. It doesn't predict price. It describes sentiment: the emotional temperature of the market at any given moment.
That distinction matters. A lot of traders treat it like a trading signal. It isn't one. It's context.
What does one year of data actually show?
We pulled daily Fear & Greed readings alongside BTC's closing price for every day from March 21, 2025 to March 20, 2026. Here's the breakdown:
| Classification | Days | % of Year |
|---|---|---|
| Extreme Fear (0–24) | 113 | 31% |
| Fear (25–49) | 84 | 23% |
| Neutral (50–54) | 48 | 13% |
| Greed (55–74) | 118 | 32% |
| Extreme Greed (75–100) | 2 | <1% |
The market spent nearly a third of the year in Extreme Fear and another third in Greed. Neutral was the rarest state; the index seldom sits still.
The two most important data points from this period:
The lowest reading of the year was 5, on Feb 12, 2026, with BTC closing at $66,938. That was the cycle low. The index hit its floor on the exact day price bottomed. From there, BTC has since climbed back to $70,613.
The highest reading was 79, on Jul 12, 2025, with BTC at $117,571. The market crossed into Extreme Greed only twice in 365 days, and both readings clustered near that all-time high. Within two weeks, price had begun the correction that eventually carried BTC down to $64,578 by late February 2026.
The extremes tell a story. The problem is that by the time you see an extreme reading, the move that caused it has already happened.
Does extreme fear always mean it's time to buy?
This is the question everyone asks. The honest answer: not exactly.
Looking at the 30-day forward returns after every day where the Fear & Greed Index read 25 or below, the average return was -2.3%, with only 47% of readings followed by a positive 30-day outcome. That's barely better than a coin flip.
So why does the "buy the fear" rule get repeated so often? Because it works at the real extremes, the single-digit readings, not across all readings below 25.
When the index hits single digits (it read 5–8 through most of February 2026), BTC was already in a full capitulation. Those specific readings, not just any "Extreme Fear" tag, tended to mark the floor. The problem is that you can't know in real time whether 23 is the bottom or whether the index will continue falling to 8. You need other signals to confirm.
That's what makes the current reading worth tracking. The index is at 12 (one of the deepest readings of the past year), and BTC is holding at $70,613, above the February lows but not making new highs. RSI is at 44.6 (Neutral). Price isn't collapsing, but it's not recovering cleanly either. That kind of standoff between deep fear and flat price is common before a directional move resolves.
Three mistakes traders make with the Fear and Greed Index
Mistake 1: Using it as a buy or sell trigger
The index shows what the crowd is feeling, not where price is going. Buying every time the reading drops below 25 would have produced mixed results over the past year, with returns averaging negative over the following 30 days. The index is most useful when combined with price structure and momentum indicators. On its own, it's incomplete.
Mistake 2: Ignoring how long the reading has been sustained
There's a difference between seeing a single day at Fear & Greed 23 and seeing 30 consecutive days below 20. By mid-February 2026, the index had been below 15 for nearly three weeks straight. That kind of sustained fear, a cluster rather than a spike, is historically more meaningful than a single extreme reading. When fear is persistent, sellers have exhausted themselves. A single bad day rarely means that.
Mistake 3: Confusing short-term sentiment with cycle position
The index describes the market's current mood, not where we are in the broader cycle. In February 2026, Extreme Fear coincided with BTC trading 43% below its $117,571 cycle high. That context matters a lot. Fear during a correction from all-time highs means something different than fear near multi-year lows. If you want signals that factor in this broader context automatically, CryptoEngine's trade alerts layer RSI, dominance, and price structure on top of sentiment so you're not reading one indicator in a vacuum.
How the Fear and Greed Index fits with other signals
Sentiment is one layer. Price momentum is another. Here's how they line up right now, as of March 20, 2026.
The Fear & Greed Index reads 12, close to the floor it hit in February (F&G=5). That tells you the crowd is still in shock from the earlier correction, even though BTC is $3,600 above its cycle low.
RSI(14) is at 44.6, firmly neutral. There's no momentum in either direction right now. Price isn't breaking down, but it's not building upward pressure either. BTC is at $70,613, essentially flat on the week.
BTC dominance is at 56.8%, still elevated. Traders aren't rotating aggressively into altcoins. Risk appetite is low, which fits the F&G reading.
Put those three together and the picture is a market in wait-and-see mode. Nobody is capitulating further, but nobody is buying aggressively either. The practical implication: sentiment is not a headwind right now. If price breaks higher from here, there's a large pool of sidelined buyers who haven't re-entered yet. That's fuel for a move, not a ceiling.
The move from Feb 12 (F&G=5, BTC=$66,938) to today (F&G=12, BTC=$70,613) shows how long fear can persist after a bottom. Price is up $3,675 from the low. The index has barely moved. Most traders who act early aren't making a prediction. They're reading multiple signals at once and moving when several align.
Frequently asked questions
What is the crypto Fear and Greed Index? The Fear and Greed Index is a daily sentiment score from 0 to 100 that measures the emotional temperature of the crypto market. It combines price volatility, momentum, social media activity, Bitcoin dominance, and search trend data into a single number. A score below 25 is Extreme Fear; above 75 is Extreme Greed.
What does Extreme Fear mean for Bitcoin price? Extreme Fear means most market participants are in a risk-off or panic mindset. Deep extreme fear readings (F&G in single digits) have coincided with price bottoms over the past year: the lowest reading (F&G=5) landed on the same day BTC hit its cycle low of $66,938. That said, 30-day returns after any Extreme Fear reading average -2.3%, so the reading alone isn't a reliable buy trigger.
How do I use the Fear and Greed Index in my trading? Use it as context alongside price and momentum indicators, not as a standalone signal. Check whether the reading is a one-day spike or a sustained extreme. Cross-reference with RSI and BTC dominance. When all three align (fear is high, momentum is turning positive, dominance is rising), that setup is more meaningful than any single indicator on its own.
When is the Fear and Greed Index most useful? At the extremes. A reading of 5 or 79 is more informative than a reading of 35. The deeper the extreme, the more likely the market is at a sentiment turning point. The index is least useful in the 30–60 range, where it's telling you the market is indecisive, which you probably already knew from the price action.
Is the Fear and Greed Index accurate? It accurately reflects market sentiment. Whether that sentiment translates into predictable price moves is a separate question. The index is a better tool for identifying emotional extremes than for timing exact entries and exits. It's one input, not a complete system.
Disclaimer: This article is for educational purposes only and does not constitute financial advice. Past performance does not guarantee future results. Always do your own research before making trading decisions.
Market data via CoinGecko. Fear & Greed Index via Alternative.me.