How to Read Bitcoin Technical Analysis as a Beginner
Bitcoin trades at $64,083 with RSI 46.4 (Neutral) and Fear & Greed at 28 as of July 29, 2026. Reading BTC technical analysis means combining momentum, price structure, and sentiment into a directional bias. When all three point the same direction, a setup is worth acting on.
How to Read Bitcoin Technical Analysis as a Beginner
Most traders who blow up their BTC positions aren't ignoring price. They're reading the wrong things, or reading the right things in isolation. Bitcoin technical analysis for beginners comes down to three questions: what does momentum say, where has price historically reacted, and is the market emotionally overextended?
Answer all three and you have a directional bias. Not a guarantee — a reason to be positioned one way over another.
TL;DR
- Bitcoin trades at $64,083 as of July 29, 2026, with RSI(14) at 46.4 (Neutral) and Fear & Greed at 28 (Fear).
- RSI measures momentum on a 0–100 scale; readings below 30 historically precede recoveries, above 70 historically precede pullbacks.
- Support and resistance are price levels where the market has repeatedly acted; a support break often signals a short-term trend shift.
- Fear & Greed at 28 means the market is in fear territory but not yet at the extremes that have historically marked BTC bottoms.
- Any one of these indicators used alone is noise. Combined, they give you context.
What Does Bitcoin Technical Analysis Actually Measure?
Bitcoin technical analysis for beginners often gets taught as a list of indicators to memorize. That's the wrong approach. Technical analysis is the use of price history, volume, and market indicators to identify trade setups. It does not predict price. What it does is describe current conditions and how similar conditions have historically resolved.
Three categories of tools matter most. Momentum indicators like RSI measure whether a move is overextended or has room to continue. Price structure (support and resistance levels) shows where buyers and sellers have historically concentrated. Sentiment indicators like the Fear & Greed Index tell you how emotionally stretched the market is.
The trap most beginners fall into is treating any one of these as a standalone trigger. RSI below 30 looks like a buy. Extreme fear looks like "everyone's panicking, time in." Support holding looks like a floor. None of these mean much without the other two pointing the same direction.
How Do You Read RSI for Bitcoin Trades?
RSI (Relative Strength Index) is a momentum oscillator running from 0 to 100. It measures how fast and how far BTC has moved in one direction over the past 14 periods, relative to the other direction.
Here's how the zones map to actual market behavior:
| RSI Range | Zone | What It Means |
|---|---|---|
| 0 to 29 | Oversold | Selling has been extreme; recoveries are common from here |
| 30 to 44 | Approaching oversold | Momentum softening; look for a support level below |
| 45 to 55 | Neutral | No strong directional pressure; often a consolidation phase |
| 56 to 70 | Approaching overbought | Buyers in control; trend can continue but risk is rising |
| 71 to 100 | Overbought | Buying has been extreme; pullbacks are common from here |
BTC's RSI(14) sits at 46.4 as of July 29, 2026: neutral territory. No momentum signal either way.
The chart below shows how RSI extremes have lined up with major BTC turning points over the past year. Those overbought readings above 70 tend to appear right before reversals. The oversold dips below 30 have often been the best entry windows, but only when a structural support level was present underneath.
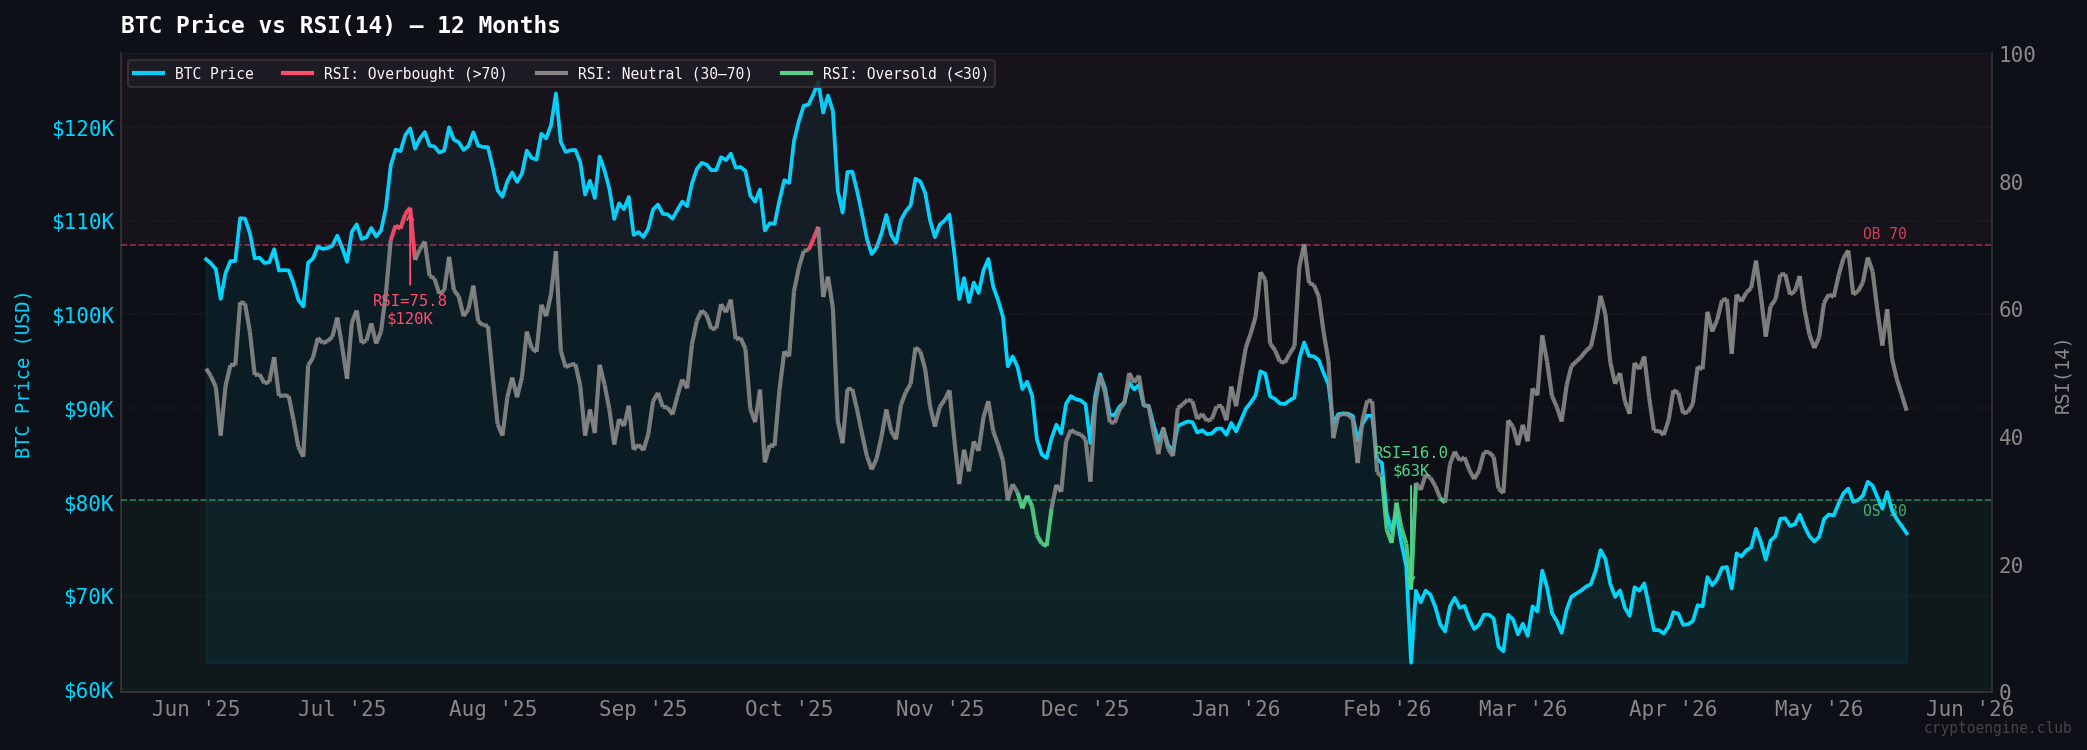
One thing to remember: RSI doesn't tell you when to enter. It tells you whether momentum is stretched. You still need a price level.
What Are Bitcoin Support and Resistance Levels?
Support is a price where enough buyers show up to stop a decline. Resistance is a price where enough sellers show up to stop a rally. These levels form at round numbers, previous highs and lows, and areas where a lot of trading happened in the past.
They're not magic lines. What they represent is market memory. Participants who traded at those prices tend to act again when price returns.
Here's a rough picture of the current BTC structure around $64,083:
~$68,000 ──── Resistance zone (area where recent rallies have stalled)
~$66,000 ──── Interim resistance
$64,083  ←─── Current price (July 29, 2026)
~$62,000 ──── Near support (prior consolidation base)
~$59,500 ──── Deeper support (prior swing low)
On July 27, CryptoEngine logged a SHORT signal at $63,750 with the reason "Uptrend falling below support." That's a support break: a level that was holding stopped holding, and the short-term structure shifted.
Support breaks matter because what was a floor can become a ceiling. If BTC bounces back to the broken level and sellers step in again, that's confirmation of a structural change, not just noise.
Does Fear and Greed Actually Help You Trade Bitcoin?
The Fear & Greed Index reads 28 (Fear) as of July 29, 2026. Here's how the full scale maps to what's actually happening in the market:
| F&G Range | Zone | Historical Pattern |
|---|---|---|
| 0 to 24 | Extreme Fear | Capitulation zone; historically a better long entry window |
| 25 to 45 | Fear | Sellers emotionally in control; often a discount zone, not a bottom signal |
| 46 to 54 | Neutral | No strong emotional bias |
| 55 to 74 | Greed | Buyers chasing; entries here carry more risk |
| 75 to 100 | Extreme Greed | Euphoria; historically precedes sharp corrections |
At 28, we're near the lower edge of the fear zone. Not extreme fear. The kind of reading that has historically lined up better with BTC bottoms sits below 25. A reading of 28 with RSI at 46.4 and a recent support break is not a buy signal. It's a market in a choppy, mildly bearish condition.
Where the index gets useful is at the extremes. Fear below 15 combined with RSI approaching 30 and price sitting on a major support: that's a setup worth watching. Right now, we're not there.
The worst use of Fear & Greed is treating it as a timer. A reading of 28 can become 10 before it becomes 50. It can stay in the fear zone for months during sustained downtrends. Use it to calibrate how emotionally overextended the market is, not to pick exact entries.
How CryptoEngine Uses Technical Analysis in Its Signals
CryptoEngine combines RSI, price structure, and sentiment into a single directional call with a defined entry, stop-loss, and take-profit.
The active signal as of July 29, 2026, is SHORT, entered at $63,750 on July 27. The logged reason: "Uptrend falling below support." That's a price structure read. When a previously holding support breaks, the short-term structure shifts against buyers, and the signal reflects that bias.
This is not a price prediction. The signal doesn't say BTC is going to $60,000. It says the current conditions (structure, momentum, and sentiment combined) tilt the probability toward further downside over the next few days. Whether that plays out depends on what happens next.
The win rate across the last 10 completed signals (5-day return metric) is 10/10. That's worth noting, but past performance doesn't tell you what the next signal does. What the approach does is give every call a systematic basis rather than a gut read.
See how CryptoEngine's signals work →
Common Mistakes Beginners Make Reading BTC Technical Analysis
The first mistake is trading RSI in isolation. RSI at 28 looks like a screaming buy, and during some markets it is. But during trending downturns, BTC can stay below 30 for weeks while price keeps falling. In the 2022 bear market, RSI sat in oversold territory for extended stretches while price dropped more than 50% from its peak. Oversold RSI without a structural support level underneath is a warning that selling has been extreme, not a floor. Before acting on an RSI extreme, check what's structurally below the current price.
The second mistake is treating support as guaranteed. "BTC has support at $62,000" is not the same as "BTC will bounce at $62,000." It means buyers have historically stepped in there. If macro conditions shift or selling pressure is heavy enough, that level gives way. The fix: know in advance what you'll do if the support breaks, because assuming it holds without a plan is how traders turn small losses into large ones.
The third mistake is using Fear & Greed as a buy trigger on its own. Fear at 28 can become 10 before it becomes 50. The index tells you the emotional temperature of the market, not when price will turn. Buying at "fear" while RSI is declining and price is below support is not contrarian investing. It's catching a falling knife with optimism instead of a trade plan.
How It All Fits Together
The setup that has historically produced the clearest entries looks like this: RSI declining into or below 30, price sitting at a support level that has held multiple times, and Fear & Greed below 25. When all three point in the same direction, the probability of a meaningful reaction is high enough to build a trade around.
What we have right now is more ambiguous. RSI at 46.4 is neutral, no momentum bias in either direction. A support level broke on July 27, which triggered a SHORT with a reasonable structural basis. Fear & Greed sits at 28, in fear but short of the extremes that have historically marked bottoms.
Put those together and you get: mild short-term bearish lean, no capitulation signal yet. That tells you the risk of a high-conviction long entry here is elevated. It tells you the active SHORT at $63,750 has a structural basis worth respecting. And it tells you the market hasn't yet hit the kind of extreme that would flip the read.
That's what reading BTC technical analysis actually looks like most of the time. Not a clean answer, but a directional lean with specific levels to watch.
Frequently Asked Questions
What is bitcoin technical analysis for beginners? Bitcoin technical analysis for beginners means learning to use price history, volume, and indicators like RSI, support and resistance levels, and the Fear & Greed Index to identify trade setups. It describes current market conditions and how similar conditions have historically resolved. The output is a directional bias, not a prediction.
What RSI level signals a buy for bitcoin? RSI below 30 is the traditional oversold level and has historically been associated with BTC recoveries. It works best when it coincides with a support level holding and Fear & Greed below 25. RSI alone at 28 is not a buy signal. It's one piece of context. Without a structural floor and a capitulation-level sentiment reading, oversold RSI during a downtrend can get more oversold.
How accurate is the Fear and Greed Index for bitcoin? The index is a reliable sentiment measure but a poor entry timer. Extreme Fear readings below 25 have historically lined up with major BTC lows, but they can persist for weeks, and the exact bottom is impossible to call from the index alone. It's most useful as a confirmation tool alongside RSI and price structure rather than a standalone trigger.
What does it mean when bitcoin breaks support? A support break means buyers who previously defended that price level have stopped. The structural read changes: what was a floor can now act as resistance on any bounce. CryptoEngine logged "Uptrend falling below support" as the reason for its July 27 SHORT at $63,750: that's a textbook support break that shifted the near-term setup from neutral to bearish.
Can beginners use technical analysis to trade bitcoin? Yes, but the bar is understanding what each tool actually measures, not just knowing its name. RSI measures momentum. Support and resistance describe historical behavior. Fear & Greed measures market sentiment. Using all three together is more reliable than picking one. The learning curve is reading them as a system: knowing when they agree, when they disagree, and what to do in each case.
Disclaimer: This article is for educational purposes only and does not constitute financial advice. Past performance does not guarantee future results. Always do your own research before making trading decisions.
Market data via CoinGecko. Signal data from CryptoEngine.