How to Read BTC Candlestick Charts: Patterns That Matter
BTC trades at $76,386 with RSI at 52.9 (Neutral) and Fear & Greed at 34 (Fear) as of May 27, 2026. Candlestick wicks record where buyers and sellers were rejected. Every reversal in BTC starts with wicks changing character before price confirms the move.
How to Read BTC Candlestick Charts: Patterns That Matter
Most traders open a BTC candlestick chart and see noise. That changes once you understand what each candle is recording. A candlestick isn't a price tick. It's a compressed record of who won and who lost during a specific time window, and once you can read that record, you stop reacting to price and start reading the story behind it.
TL;DR
- Each BTC candlestick captures four prices: open, high, low, and close for one time period (1h, 4h, or daily).
- The body shows the range between open and close. The wicks show how far price traveled before being rejected.
- Hammer patterns at support and shooting stars at resistance are the most traded reversal setups in BTC.
- Dojis signal indecision, not direction. They need confirmation from the next candle before you act on them.
- BTC's RSI is 52.9 (Neutral) as of May 27, 2026. Candlestick patterns carry less weight in neutral territory than at RSI extremes.
What does a BTC candlestick actually record?
A BTC candlestick is four numbers: the price when the candle opened, the highest price reached during the period, the lowest price reached, and the price when it closed. Everything else is interpretation.
The body is the rectangle connecting open and close. A green body means price closed higher than it opened. A red body means it closed lower. Neither color tells you anything about the day's full range.
The wicks, also called shadows, extend above and below the body. They record where price traveled and then got rejected. A long upper wick means buyers pushed price higher but sellers drove it back down before the candle closed. A long lower wick means sellers forced price down, buyers stepped in, and price recovered.
     |          <- Upper wick: how high price reached before rejection
    ___
   |   |        <- Body: range between open and close
   |___|
     |          <- Lower wick: how low price reached before recovery

Green body = price closed above where it opened (bullish close)
Red body   = price closed below where it opened (bearish close)
If you take one thing from this, make it this: the wicks are where the real fight happened. A candle with no body and long wicks in both directions (called a Doji) means neither buyers nor sellers won the period. Nobody controlled it.
What do the wicks tell you that price alone doesn't?
The closing price tells you the outcome. The wicks tell you what was attempted and failed.
Long lower wicks near a known support zone mean buyers showed up. They may not have been strong enough to push a green close, but they cared enough to fight. A support level where multiple candles show lower-wick rejections is a level that buyers have defended repeatedly. That's meaningful context.
Long upper wicks near resistance tell the opposite story. Sellers kept pushing back against any attempt to break higher. When you see three or four daily candles in a row with upper wicks hitting the same price ceiling, that ceiling has teeth.
Right now, BTC is at $76,386, about $700 below the May 25 LONG signal entry at $77,093. That entry fired when the candles shifted from upper-wick rejections at resistance to closes above it. The structure changed before the signal was issued. That is what you're reading in candlestick charts: not what price is doing right now, but what the market is telling you about who's in control.
How to spot the patterns BTC traders actually use
Most candlestick textbooks list dozens of patterns. In practice, BTC traders use maybe five of them regularly. Here are the ones that matter.
Hammer
A small body at the top of the candle with a lower wick at least twice the body's length. When it forms at a support level after a sustained downtrend, it tells you sellers pushed hard but buyers overwhelmed them by close. The longer the lower wick relative to the body, the more forceful that buyer response was.
    ___
   |   |     <- Small body, near the top of the candle
   |___|
     |
     |       <- Long lower wick (sellers pushed, buyers absorbed it all)
     |
Shooting star
The inverse of a hammer. Small body at the bottom, long upper wick extending above it. Forms at resistance after an uptrend. Buyers tried to push higher; sellers rejected them and drove price back down. BTC printed this pattern multiple times at major resistance levels, and the reversal typically followed within one to three daily candles.
     |
     |       <- Long upper wick (buyers pushed, sellers rejected the move)
     |
    ___
   |   |     <- Small body, near the bottom of the candle
   |___|
Doji
Open and close at nearly the same price. Tiny body, wicks extending in both directions. On the daily chart, this means neither side controlled the day. By itself, a doji is a pause. Not a direction. The next candle tells you who broke the tie.
Jumping into a trade based on a doji before that confirmation candle closes is one of the most common errors traders make.
Engulfing pattern
A two-candle setup. A bullish engulfing is a red candle followed by a green candle whose body completely covers the prior red body. Buyers overwhelmed the prior session's sellers in a single candle. Bearish engulfing is the reverse. These carry more weight on higher timeframes (4h and daily) than on 1h or 15m charts.
| Pattern | What the candle tells you | Where it matters most |
|---|---|---|
| Hammer | Sellers overwhelmed at a low | Tested support levels |
| Shooting star | Buyers rejected at a high | Known resistance zones |
| Doji | Neither side in control | Before key decision levels |
| Bullish engulfing | Buyers took full control in one period | After a sustained downtrend |
| Bearish engulfing | Sellers took full control in one period | After a sustained uptrend |
Is a single candlestick pattern enough to trade?
No.
A hammer at support tells you something. A hammer in the middle of a range with no structural context tells you almost nothing. The pattern only carries weight when it appears at a location that already matters: a tested support level, a prior high, a trend line that price has respected multiple times.
Context checklist before acting on any pattern:
- Where is this candle forming relative to known support or resistance?
- What is RSI doing on the same timeframe? A hammer at support with RSI below 30 is a much stronger signal than a hammer with RSI at 60.
- What is the trend on the next higher timeframe? A 1h hammer inside a 4h downtrend is a lower-odds setup than one at a higher low in an uptrend.
- Does the pattern have confirmation? Dojis and single-candle reversals need the following candle to confirm direction before you act.
As of May 27, 2026, BTC's RSI sits at 52.9. That's neutral territory: not oversold, not overbought. Candlestick reversal patterns in neutral RSI conditions produce more false signals than the same patterns at RSI extremes.
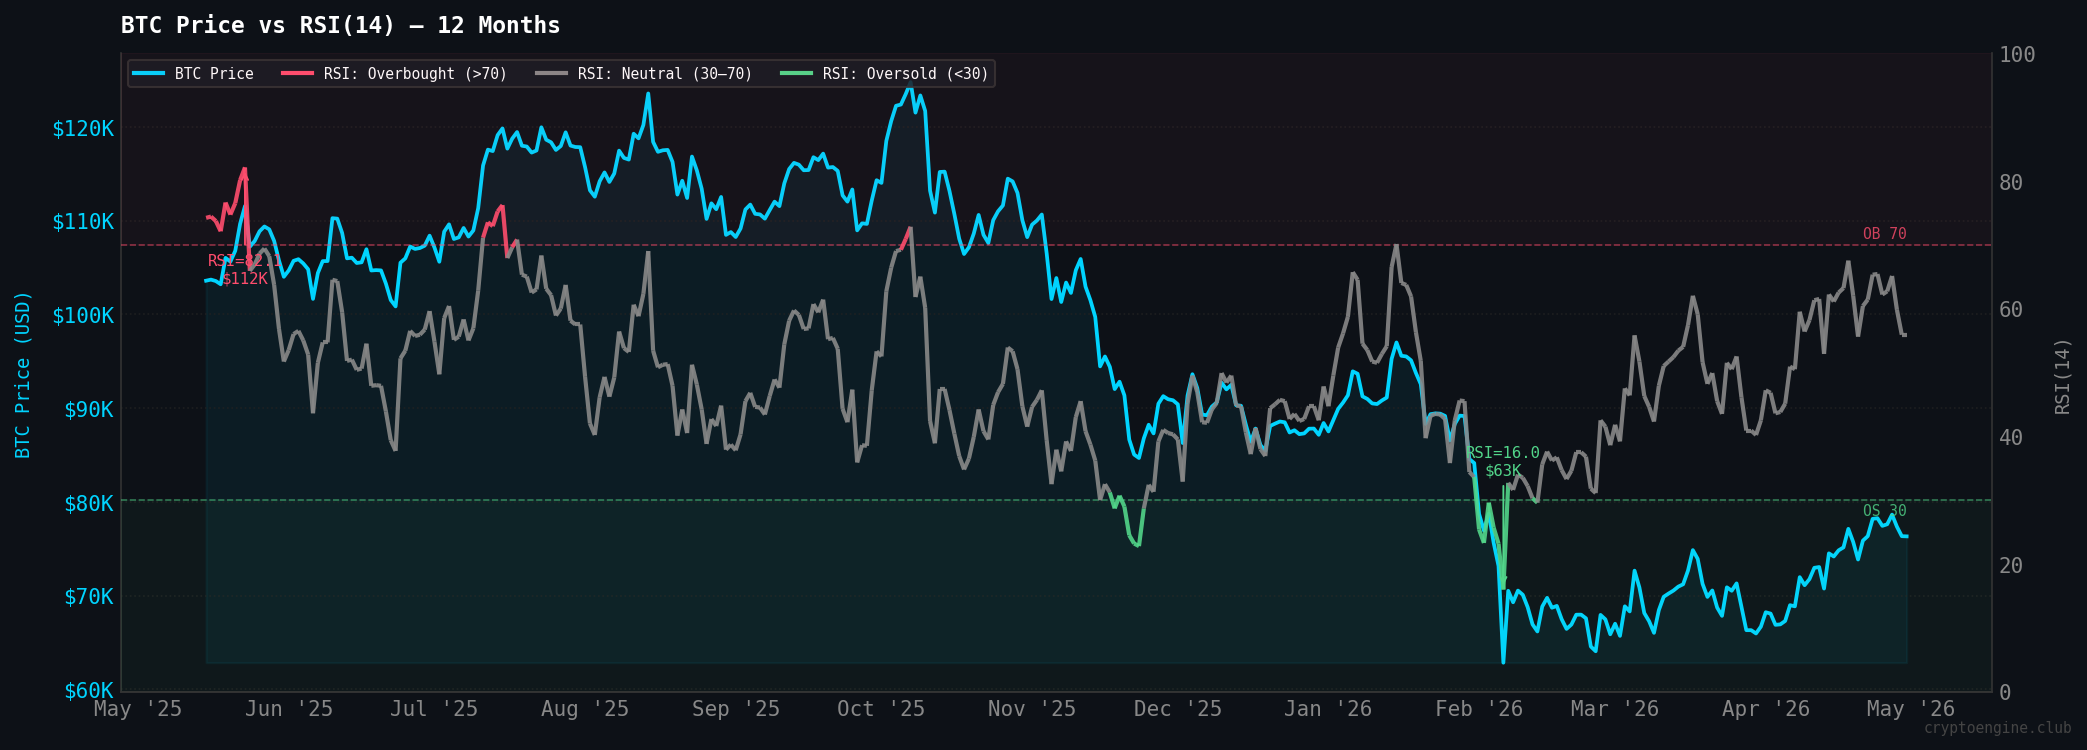
The chart below shows how RSI and BTC price have tracked over the past 12 months. Notice how the most reliable reversal points coincide with RSI reaching its extremes, not its midpoint. The patterns that pay are almost always at the edges.
How it all fits: candlesticks, RSI, Fear & Greed, and CryptoEngine signals
Candlestick patterns, RSI, and the Fear & Greed Index each answer a different question.
Candlesticks answer: what did buyers and sellers actually do at this price level? RSI answers: is momentum building or fading, and is the market stretched in either direction? Fear & Greed answers: what is the emotional state of the broader market? With all three, you get more signal than any one can give you alone.
Here is how they stack in practice:
| RSI zone | Fear & Greed | Best candlestick signal | Trade bias |
|---|---|---|---|
| Below 30 (oversold) | Extreme Fear | Hammer or bullish engulfing at support | High-probability long setup |
| Above 70 (overbought) | Extreme Greed | Shooting star or bearish engulfing at resistance | High-probability short/exit |
| 40–60 (neutral) | Neutral or Fear | Any reversal pattern | Lower odds, wait for better location |
| Divergence (price lower, RSI higher) | Fear | Bullish pattern at support | Watch closely for reversal |
With RSI at 52.9 and Fear & Greed at 34, the current setup lands squarely in the middle of the table. The candlestick evidence that matters most right now isn't any single candle. It's whether the sequence of daily candles around $76K–$77K shows buyers holding or sellers taking over.
CryptoEngine's signals treat candlestick structure this way: not as a standalone trigger, but as one input that confirms or contradicts what RSI and sentiment are showing. The May 25 LONG entry at $77,093 fired when the candles shifted character at resistance, closes breaking above rather than being rejected below. That's the candlestick pattern. RSI and sentiment provided the confirmation context.
If you want to see how that context plays out in real entries with defined stop and target levels, CryptoEngine's signal history shows every call going back to inception.
Common mistakes when reading BTC candlestick charts
The single biggest error is trading patterns without location context. A hammer anywhere on the chart is not a buy signal. A hammer at a level where price has bounced before, where RSI is low, after a downtrend — that's a setup. The difference between those two things is everything.
Close behind it: acting on a doji before the next candle closes. A doji on the daily chart means the day ended even. You don't know who won until the following session closes. Plenty of traders take a position on a doji expecting a reversal and get stopped out by the confirmation candle going the wrong way.
Then there's the timeframe mismatch. A bullish hammer on the 15m chart doesn't mean much if the 4h chart shows a sustained downtrend with lower highs and lower lows. Check one timeframe above where you're looking for entries before acting on anything you see on the shorter timeframe.
Finally: not every wick is a rejection signal. Long wicks at random locations in the middle of a range are noise. Wicks carry meaning when they form at a price level that was already significant before the candle appeared: prior support, a prior resistance zone, a trend line that held multiple times.
Frequently Asked Questions
What is a BTC candlestick chart? A BTC candlestick chart is a price chart where each candle displays the open, high, low, and close for a given time period. The body shows the distance between open and close. The wicks extend to the period's high and low. Green candles closed above their open; red candles closed below.
What does a long upper wick mean in Bitcoin trading? A long upper wick means price pushed higher during the candle period but sellers rejected it before close. Buyers couldn't sustain the move. When this forms at a known resistance level, it signals that sellers are defending that price ceiling.
Is a hammer candlestick a buy signal for BTC? A hammer at a tested support level after a downtrend is worth watching, but it needs confirmation. The following candle should close higher before you treat it as a signal. Context matters: the same hammer in the middle of a range without structural support is not a reliable setup.
How do I combine candlestick patterns with RSI? Look for reversal patterns at RSI extremes. A hammer at support with RSI below 30 carries more weight than one with RSI at 55. An RSI divergence (where price makes a lower low but RSI makes a higher low) alongside a bullish candle setup adds meaningful weight to a potential reversal.
What is the most common mistake traders make with BTC candlestick patterns? Trading single candles without location or confirmation. A candlestick pattern only has meaning when it forms at a price level that was already significant before the candle appeared: tested support, tested resistance, or a clear trend structure. The pattern alone is not enough.
Disclaimer: This article is for educational purposes only and does not constitute financial advice. Past performance does not guarantee future results. Always do your own research before making trading decisions.
Market data via CoinGecko.