How to Trade Bitcoin in a Sideways Market: Range and RSI
BTC RSI(14) moved from 52.4 to 66.5 in three days while Fear & Greed sits at 32. The sideways phase is transitioning. Here is how to read the range, size down, and recognize when the chop is ending.
How to Trade Bitcoin in a Sideways Market: Range and RSI
Bitcoin is at $78,513 as of April 22, up 4.7% on the week. RSI(14) is at 66.5. Three days ago it was 52.4. That jump is the sideways phase starting to crack. Fear and Greed sits at 32, still in Fear despite the price move. The crowd hasn't bought in yet. This is what a ranging market looks like on the way out, and the traders without a plan for this transition are the ones who get caught.
TL;DR
- BTC RSI(14) jumped from 52.4 to 66.5 between April 19 and April 22: neutral zone is gone, momentum is building
- Fear and Greed reads 32 (Fear) while price climbs, the crowd still hasn't committed
- BTC dominance at 58.1%, capital staying in BTC rather than rotating to alts
- In a ranging market, smaller positions at defined boundaries beat conviction trades in the middle
- CryptoEngine's April 15 LONG closed -0.5% (wrong call); the active SHORT from April 19 at $74,137 is now down 5.9%
What is a sideways Bitcoin market?
A sideways Bitcoin market is when price consolidates within a defined range without making meaningful new highs or lows. Traders call it ranging, consolidation, or chop. Neither bulls nor bears control the tape long enough to establish a trend.
RSI(14) is the simplest diagnostic. When it reads between 40 and 60, momentum is absent in both directions. BTC can still move within that zone, but the moves tend to be short-lived and unreliable for directional trades. As of April 22, RSI is at 66.5, up from 52.4 three days ago. That is the first real sign a ranging phase may be ending.
The table below maps each RSI zone to what it signals about market behavior:
| RSI Range | Zone | What it signals |
|---|---|---|
| 70–100 | Overbought | Momentum stretched; breakout continuation is lower probability |
| 60–70 | Mildly bullish | Trend building; entries still valid with confirmation — BTC as of Apr 22: 66.5 |
| 40–60 | Neutral | Ranging/consolidating; momentum absent in both directions |
| 30–40 | Mildly bearish | Trend fading; downside follow-through possible |
| 0–30 | Oversold | Momentum stretched to the downside; bounce risk elevated |
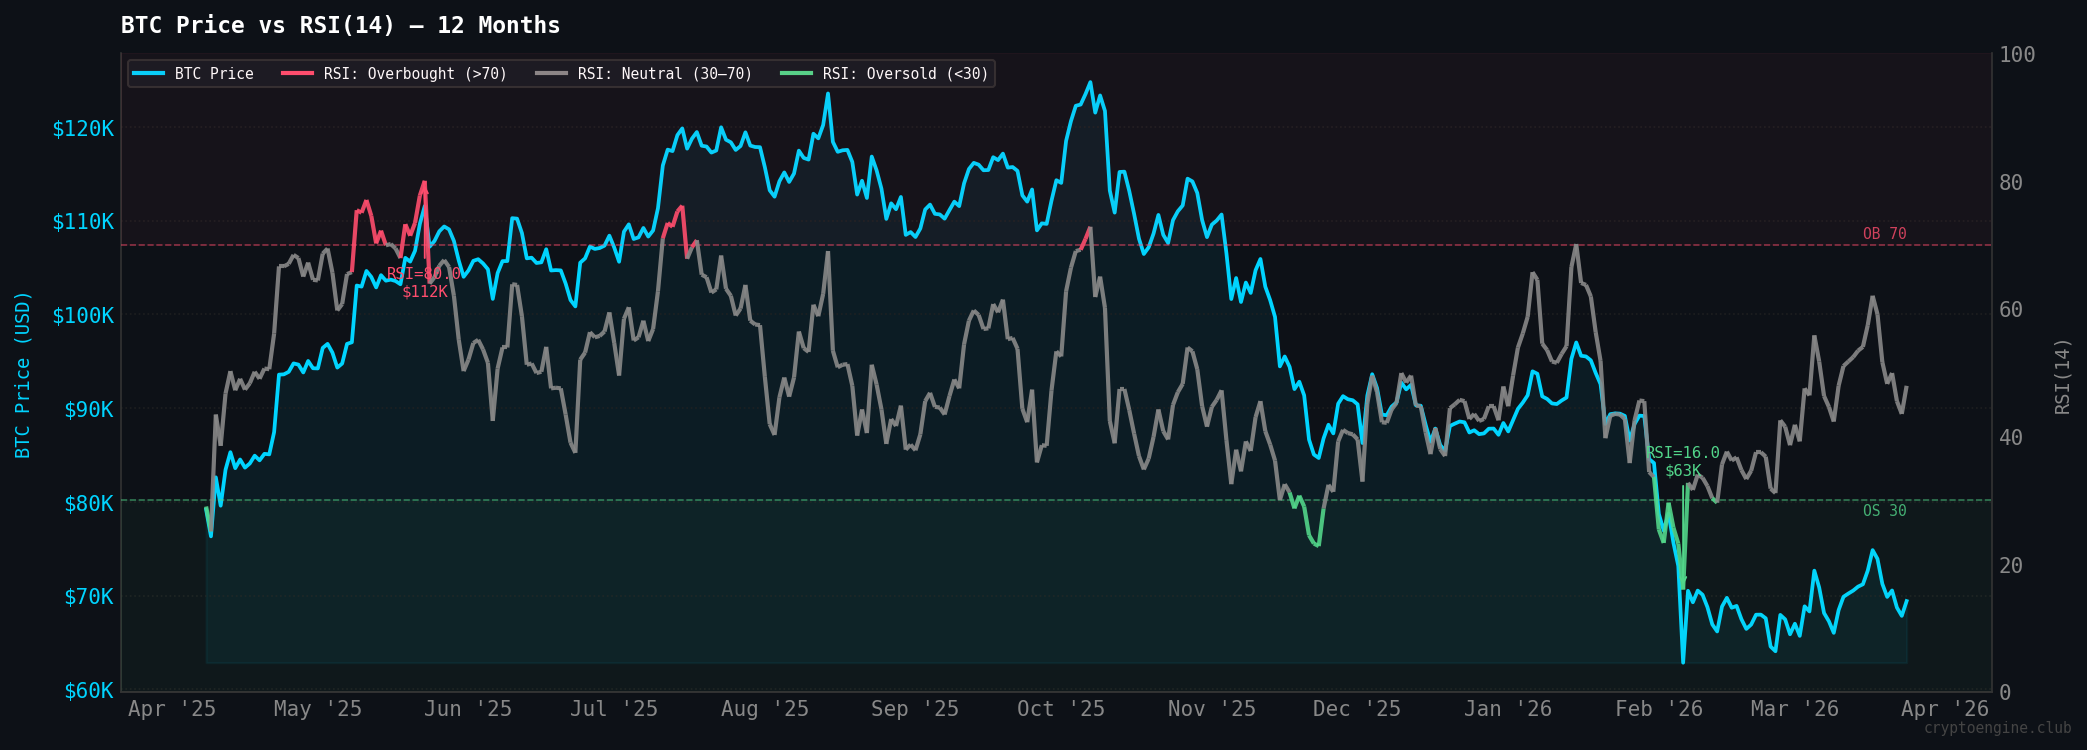
The 12-month chart below shows how RSI has tracked alongside BTC price through previous ranging and trending phases, including the zones where momentum stalled or picked up:
For a closer look at how RSI works as an entry and exit tool, see Bitcoin RSI: how to use it for entry and exit signals.
Why do sideways markets trip up most traders?
Most traders are wired for trending markets, not ranging ones. When price moves, the instinct is to pick a direction. In consolidation, that instinct costs you money.
Three traps catch traders in ranging BTC conditions:
-
Buying into a false breakout near the top of the range. A rally toward resistance looks like trend resumption. Without a confirmed close above resistance with RSI moving above 60, it usually is not. Most entries near the range high turn into losses when price reverts.
-
Panic-selling fake breakdowns near range lows. Price dips toward support, looks like the start of a flush, traders exit, then BTC reverses right back. Ranging markets do this consistently.
-
Holding through repeated failed breakouts. Each time a breakout fails and price drifts back into the range, the position just sits there. Frustration builds. You make a worse decision on the next entry.
The honest answer for most traders here: reduce size, or wait.
How to identify the range before you trade it
Before you trade a sideways market, you need to know what you are working with. That means finding where price keeps bouncing (support) and where it keeps stalling (resistance).
A practical process on the daily chart:
- Find the most recent clear swing high and swing low over the past two to four weeks
- Mark those levels as your range boundaries
- Wait for price to reach one of those boundaries with volume
- Only consider an entry after a candle closes away from the level, not before the close
Here is what that structure looks like in practice:
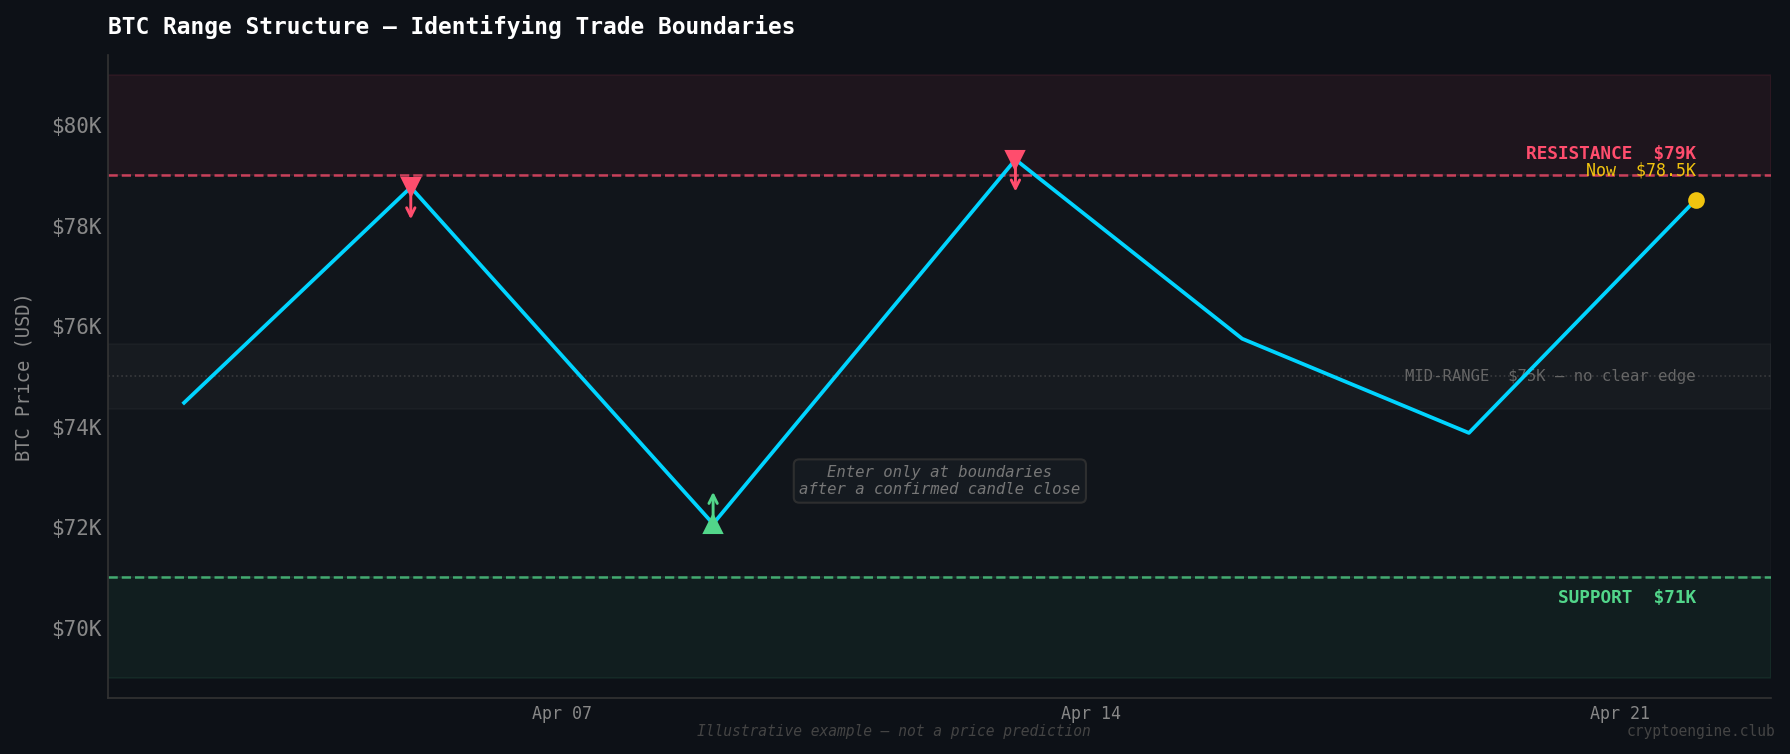
The RSI layer tells you which side has more conviction. If price tests support with RSI below 45, sellers are still in control and a bounce is a lower-confidence trade. RSI at or above 50 when support is tested means buyers haven't given up — the setup has better odds.
At 52–55, neither side has a strong argument. Sizing down matters more than picking a direction. When RSI climbs above 60 while price holds a breakout level, the argument starts tilting toward the bulls.
What does sentiment tell you in a sideways market?
Fear and Greed at 32 means the crowd is still nervous even as BTC sits at $78,513. Price is moving but confidence isn't. The people pushing BTC higher are doing it quietly, without the broader market joining in yet.
In a genuine rally, Fear and Greed climbs alongside price. When price goes up but sentiment stays suppressed, the move is fragile. The buyers driving it higher haven't pulled in the rest of the market yet, which means a lot of money is still sitting out.
The relationship between price and sentiment maps to four distinct setups:
| Scenario | Price | Fear & Greed | What it means |
|---|---|---|---|
| Confirmed rally | Up | Rising toward neutral (40+) | Crowd buying in; trend has broader support |
| Fragile recovery | Up | Still in Fear (< 35) | Buyers cautious; sidelined money hasn't committed — BTC now |
| Capitulation | Down | Extreme Fear (< 20) | Crowd panic-selling; often a contrarian setup |
| Distribution | Up | Extreme Greed (> 75) | Crowd euphoric; breakouts often fail here |
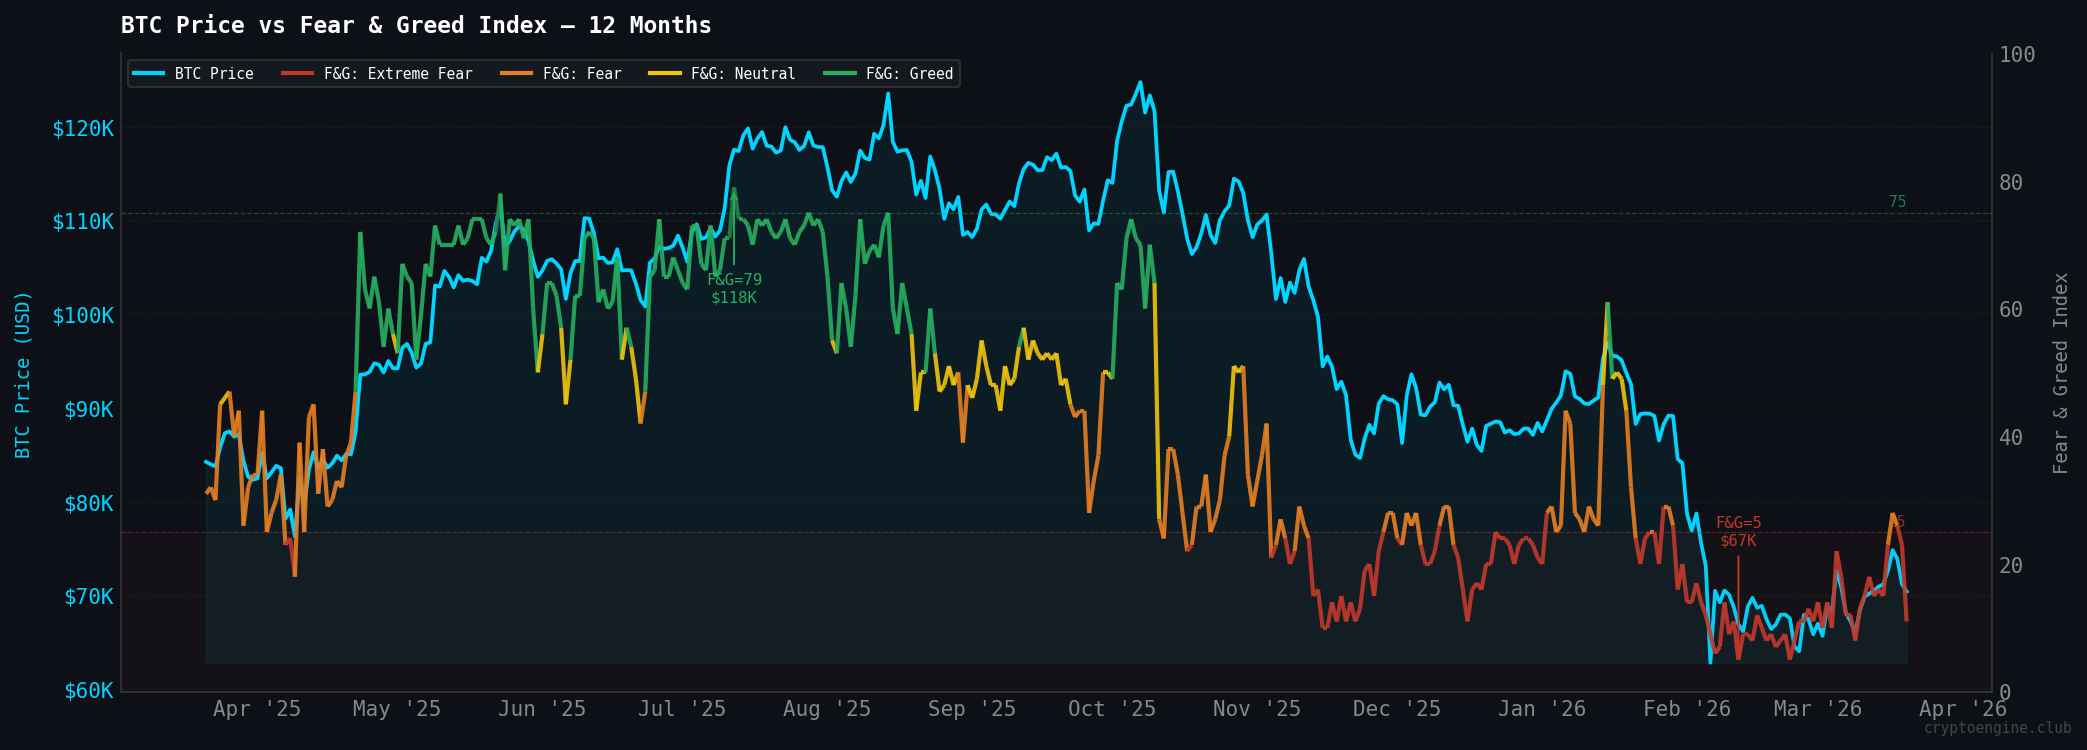
BTC is in the second row as of April 22: up 4.7% this week, Fear and Greed still at 32. The 12-month chart below shows how similar price-sentiment gaps have played out in previous cycles:
A ranging bias stays reasonable until sentiment moves above 40 and RSI holds above 60. RSI is there. Fear and Greed is not. For more on how the Fear and Greed Index fits into a trading framework, see Crypto Fear and Greed Index: what the data really shows.
How do signals work in a sideways market?
Signal-based systems break down most visibly in consolidation and in the messy transition out of it.
CryptoEngine's April 15 LONG called "uptrend breaking above resistance" with entry at $74,994. When it closed on April 20 at $74,586, it was down 0.5%. The breakout didn't hold. Wrong call.
The system then flipped to SHORT on April 19 at $74,137, calling "uptrend falling below support." BTC is now at $78,513, up 5.9% since that SHORT fired. The system is on the wrong side of the move.
Neither result means signal trading doesn't work. Range-to-trend transitions are where confirmation-based systems get whipsawed. A resistance test looks like rejection, then turns into a breakout. A support break that looks decisive reverses two days later. Any system waiting for confirmation will lag the actual turn.
Don't expect clean signals until momentum commits. RSI jumping from 52 to 66.5 in three days is momentum building. If it clears 70 while price holds the breakout level, accuracy on future LONGs improves. If RSI rolls over from here and price retests the old range, the SHORT finally gets its chance.
If you want to see how CryptoEngine sets entry, stop, and target levels for each signal, the methodology and current pricing are here.
Common mistakes in a sideways BTC market
Treating a recovery as a confirmed trend too early is the most common mistake. BTC gained 4.7% this week and RSI is at 66.5, which looks bullish on its own. But Fear and Greed at 32 hasn't confirmed sentiment is shifting. Going full-size long before both indicators agree is how traders get caught overextended when the move stalls.
Range boundaries get ignored. Traders fixated on macro narratives often lose track of the price levels that matter right now. In a ranging market, a clean test of a defined resistance level tells you more than any news story.
Overtrading does the most damage. When price chops in a range, there is a temptation to flip bias constantly, long on the bounce, short on the fade. Each flip costs money and clarity. The better approach: decide which direction has better odds, wait for price to hit a boundary, then either take the setup or stay flat.
Practical checklist for ranging conditions
Before entering any trade during a sideways BTC period:
- Have I identified the current range? (clear swing high and swing low on the daily chart)
- Is price at a range boundary, or somewhere in the middle?
- Has price rejected the level with a confirmed daily candle close?
- Is RSI(14) below 45, above 55, or in the neutral 45-55 zone?
- Does Fear and Greed support or contradict the trade direction I am considering?
- Have I sized down relative to a trending setup? (25-50% of standard size is a reasonable starting point in ranging conditions)
- Do I have a clear stop-loss and a realistic take-profit based on the opposite range boundary?
- Am I waiting for a breakout confirmation, or assuming one will happen?
If most of these cannot be answered clearly, the setup is not ready.
How it all fits together
Sideways BTC markets are where multiple indicators need to agree before you act.
As of April 22: RSI at 66.5 (above neutral, momentum building), Fear and Greed at 32 (crowd still nervous, not committed), BTC dominance at 58.1% (capital in BTC, not rotating to alts). CryptoEngine's last two signals both lost: the April 15 LONG closed -0.5%, and the current SHORT from April 19 at $74,137 is down 5.9%.
One indicator is in place. One isn't. The signal system has been wrong twice in a row. That is a transition, not a confirmed trend.
The setup worth trading needs RSI above 60, Fear and Greed above 40, and a confirmed close above resistance. RSI is there. Fear and Greed is not. Wait for sentiment to catch up before sizing up. Until both agree, smaller positions beat strong opinions.
Frequently asked questions
What does it mean when Bitcoin is trading sideways? A sideways Bitcoin market is when price consolidates within a defined range without making meaningful new highs or lows. RSI(14) between 40 and 60 is the most common indicator of this phase. Neither bulls nor bears have enough control to hold a move, and a breakout in either direction needs a real momentum shift to stick.
How do I know if BTC is in a sideways market right now? Check RSI(14) on the daily chart. A reading between 40 and 60 means neutral momentum. Also look at Fear and Greed alongside price: if BTC has rallied but sentiment is still in Fear territory, the move may not have legs. As of April 22, 2026, BTC RSI(14) is 66.5 and Fear and Greed is 32. Momentum has moved out of the sideways zone, but sentiment hasn't followed yet — the transition is in progress, not confirmed.
Should I keep trading during a sideways BTC market? Cut position size, or wait. Ranging markets generate false breakouts repeatedly, and signals that work in trends can trigger without following through. If you do trade, focus on confirmed rejections at defined range boundaries, keep stops tight, and don't call a breakout until price closes convincingly outside the range.
How do trading signals perform in a sideways BTC market? Lower reliability than in trending markets. CryptoEngine's April 15 LONG closed at -0.5% after a false breakout, then the system flipped to SHORT. BTC moved 5.9% against it. That is what choppy, transitioning markets do to systems that wait for confirmation. Accuracy comes back once momentum commits and holds.
What is the best way to size positions in a sideways BTC market? 25–50% of your normal position size is a reasonable default. Smaller size limits exposure to false breakouts while keeping you in the game if a real breakout develops. Scale toward normal once RSI moves above 60 and Fear and Greed climbs toward 40. As of April 22, RSI has cleared 60 but sentiment at 32 hasn't confirmed, so half-size is still the disciplined call.
Disclaimer: This article is for educational purposes only and does not constitute financial advice. Past performance does not guarantee future results. Always do your own research before making trading decisions.
Market data via CoinGecko.