What Is Momentum Trading in Crypto: How BTC Traders Use RSI
BTC's RSI is 44.0 (Weak/Bearish), price at $76,675 as of May 19, 2026. CryptoEngine's LONG (May 1) returned +5.6% before flipping SHORT on May 16, now +2.5% in 3 days. RSI momentum explained.
What Is Momentum Trading in Crypto: How BTC Traders Use RSI
Most traders spend all their time thinking about price. Momentum traders think about speed. It sounds like a minor distinction, but it changes everything: how you enter, how long you hold, when you exit before the crowd realizes the move is done.
TL;DR
- Momentum trading means buying when a price trend is accelerating, not just rising. The goal is early entry, not top-chasing.
- RSI(14) is the most common momentum indicator in Bitcoin markets. BTC's RSI stands at 44.0 as of May 19, 2026, a weak reading sitting just above the recovery zone traders watch most closely.
- The strongest BTC momentum setups appear when RSI crosses back above 40 after a dip, not after it clears 70.
- Momentum signals work best as confirmation tools. CryptoEngine combines RSI with support/resistance levels and BTC dominance before firing a signal.
- The biggest mistake momentum traders make is entering at RSI extremes instead of catching the move early.
What is momentum trading in crypto?
Momentum trading in crypto is built on a simple observation: assets already moving in one direction tend to keep moving that way, at least for a while. Instead of predicting bottoms or tops, momentum traders wait for a trend to show up in the data, then get in while it still has room to run.
The logic is behavioral. Markets move because traders are acting, and people tend to act in clusters. When BTC breaks through a resistance level on high volume, it triggers buying from traders who were waiting for confirmation. That buying pushes price higher, which triggers more buying. Momentum traders try to ride that wave before it crests.
In Bitcoin markets, momentum trading crypto centers on RSI, the Relative Strength Index. RSI measures the ratio of average gains to average losses over 14 periods and outputs a number between 0 and 100. A rising RSI means recent gains are outrunning recent losses. A falling RSI means sellers are winning.
Why crypto momentum is different from equities
In stock markets, fundamentals put a ceiling on how far momentum trading can run. A stock at 150x earnings will eventually face gravity when analysts start questioning the valuation.
BTC has no earnings. Its price is largely what traders collectively believe it should be at any given moment. That makes momentum a bigger force in crypto than in almost any traditional asset.
There's also the 24/7 schedule. BTC never closes. Momentum that starts in Asia can compound for days before US traders wake up to what's happening. This is part of why crypto moves look so fast and parabolic compared to equity rallies.
But crypto momentum reverses faster than most expect too. A run that looks unstoppable at RSI 68 can stall within a few sessions. That's why knowing the RSI number isn't enough. You need to know which direction it's moving, and whether volume and sentiment are backing it up.
How do BTC traders measure momentum?
RSI(14) is the starting point. Here's how traders interpret different RSI zones:
| RSI Range | Zone | What it suggests for BTC traders |
|---|---|---|
| 0-30 | Oversold | Selling pressure weakening; potential bounce zone |
| 30-50 | Weak/Bearish | Momentum is against you; wait for confirmation |
| 50-55 | Neutral | No clear trend edge; range-bound conditions likely |
| 55-70 | Building | Buyers controlling short-term direction |
| 70-100 | Overbought | Trend running hot; watch for exhaustion signals |
As of May 19, 2026, BTC's RSI(14) is 44.0. That's in the weak/bearish zone. Momentum is against you for now; you'd need a clear reversal signal before entering. RSI has been falling since mid-May, when it briefly touched 59.9 before turning over with price.
RSI alone isn't the whole picture. Volume matters just as much: a price move without volume behind it is a weak signal, while high volume on a breakout confirms real capital is moving. BTC dominance is worth watching too. When dominance rises alongside price, BTC is pulling in capital that isn't rotating into alts. Dominance stood at 58.1% as of May 19, 2026, which has historically gone with cleaner BTC-specific trends. Then there's rate of change. A slow grind and a sharp breakout both show up as "rising price" in a chart, but they behave very differently once they start running.
What does the RSI history tell us about BTC price moves?
The 12-month RSI chart shows something most traders miss: the biggest BTC moves happen right after RSI crosses back above 40 from an oversold reading, not after it clears 70.
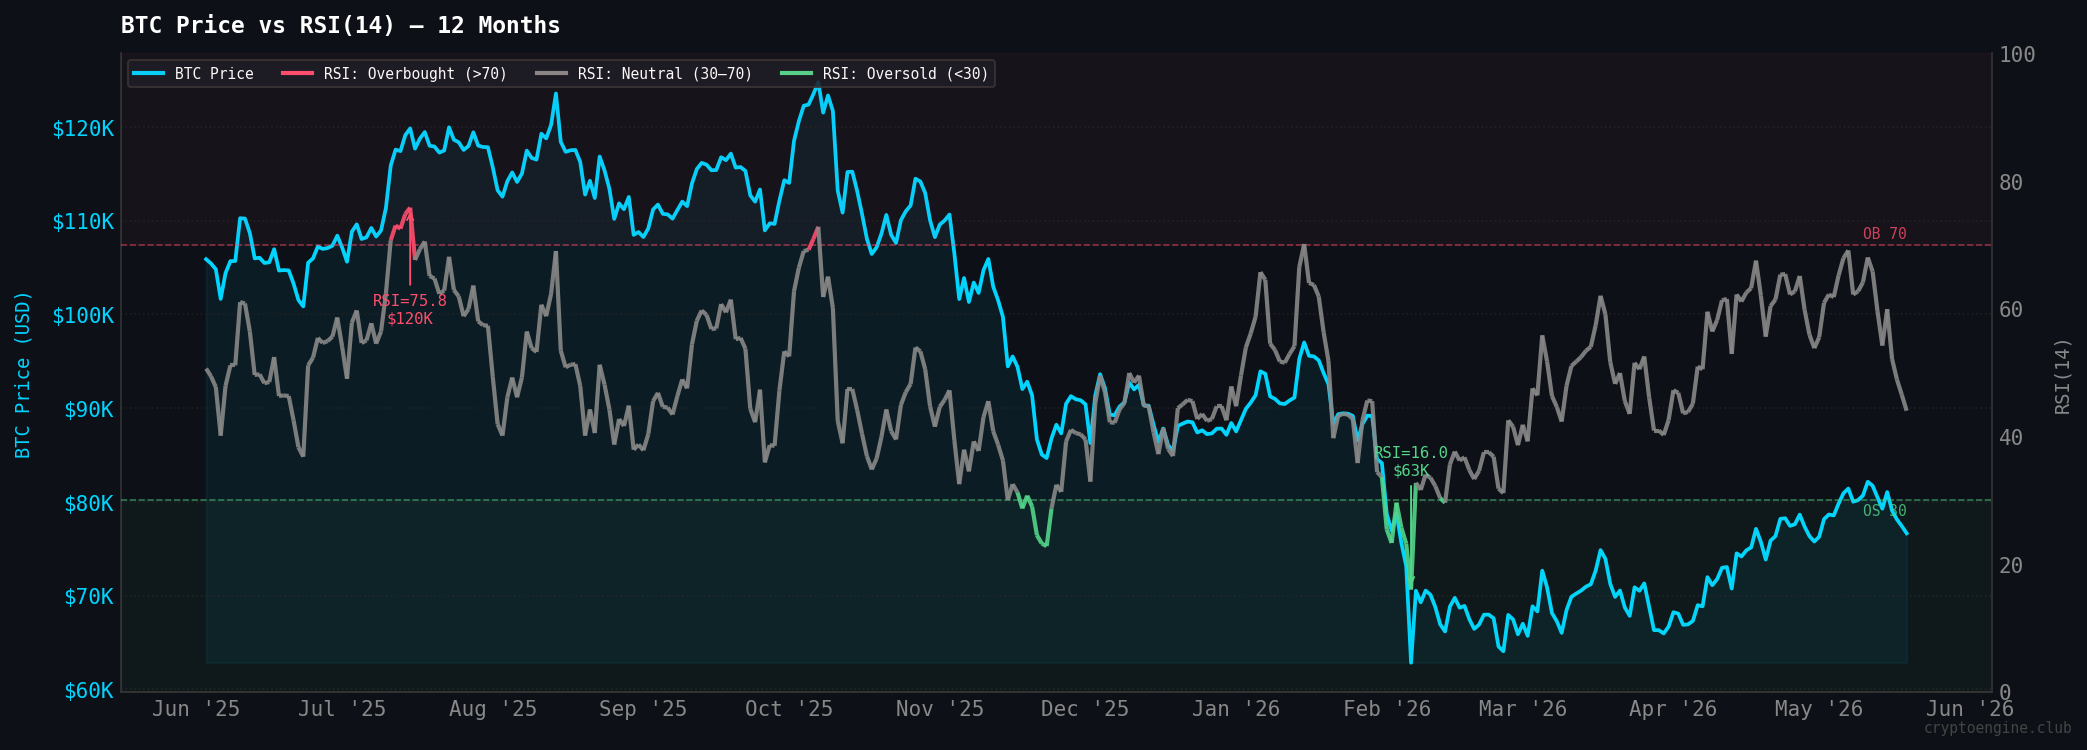
By the time RSI is deep in overbought territory, most of the move has already happened. The momentum entry is earlier, when RSI is recovering from a weak reading and the majority of traders are still cautious or flat.
Catching those early recoveries is uncomfortable. The chart looks fragile, sentiment is still negative, and there are plenty of reasons to wait. But that discomfort is part of the edge. When the setup is obvious to everyone, the trade is already crowded.
The same chart shows what overbought RSI looks like before a reversal. Readings above 70 often precede multi-week corrections. Traders who entered during those peaks because "momentum is strong" regularly find themselves holding through a significant drawdown.
How CryptoEngine uses momentum signals in practice
CryptoEngine doesn't treat RSI as a standalone trigger. One indicator isn't enough.
The system waits for agreement across indicators: RSI trending up, price above a key support level, BTC dominance confirming Bitcoin-specific buying, and Fear & Greed out of extreme territory. When those conditions line up, the signal fires with a specific entry price, stop-loss, and take-profit target.
The May 1 LONG is a clean example of how this works. The signal fired when BTC broke above resistance at $78,138, with RSI recovering from weaker readings — exactly the setup the checklist calls for. BTC ran to $81,000+. Over 10 days the signal returned +5.6%. Then, as RSI rolled over and Fear & Greed dropped from 47 (Neutral) toward fear territory, CryptoEngine flipped to SHORT on May 16.
That flip mattered. The SHORT has returned +2.5% in its first three days as BTC fell from the $81K area to $76,675. Two back-to-back correct calls: LONG caught the rally, SHORT caught the reversal. Neither was obvious at the time. The LONG fired when sentiment was still cautious. The SHORT fired before most traders had processed that the move was done.
If you want to see how this works, CryptoEngine's signal page shows the current signal direction, entry price, and the reasoning behind each call.
How momentum fits with Fear & Greed and BTC dominance
RSI, Fear & Greed, and BTC dominance reinforce each other when they agree. A quick reference matrix:
| RSI | Fear & Greed | BTC Dominance | What it suggests |
|---|---|---|---|
| Rising (above 50) | Neutral to Greedy (40-70) | Rising | BTC uptrend with broad support |
| Rising (above 50) | Extreme Fear (below 25) | Rising | Counter-trend bounce; possible but fragile |
| Falling (below 50) | Greedy (above 60) | Falling | Late cycle, altcoin rotation likely pulling capital |
| Falling (below 50) | Extreme Fear (below 25) | Rising | BTC holding but losing steam |
As of May 19, 2026: RSI at 44.0, Fear & Greed at 25 (Extreme Fear), BTC dominance at 58.1%. That's the fourth row. RSI is falling, sentiment has swung hard to fear, and dominance is holding — BTC isn't losing ground to alts, but it's losing steam on its own. No new long entry here. You're watching, not buying.
Common mistakes in crypto momentum trading
The most common error in momentum trading crypto is entering at RSI extremes. A lot of traders read "RSI is at 74" as a buy signal. That's backwards. An overbought RSI means the move is already mature. You're buying into a crowd that's already long, and the remaining upside has shrunk considerably.
Using RSI without context is the second problem. RSI tells you how fast price has moved relative to recent history, nothing more. It doesn't tell you if the move is backed by volume, if dominance is confirming it, or if sentiment is at a dangerous extreme. An RSI of 62 during extreme fear looks very different on the chart than an RSI of 62 when greed is elevated and dominance is falling.
Timeframe mismatch kills a lot of setups that looked clean. A 1-hour RSI reading is nearly meaningless for swing traders. Daily RSI is what matters for multi-day holds. Weekly RSI for longer positions. Getting these crossed creates false confidence in setups that don't have structural support.
The last mistake: confusing momentum with prediction. High RSI doesn't mean BTC will keep going up. It means BTC has been going up. The trend can stall or reverse without much notice. A signal shifts probabilities. It doesn't remove risk.
A practical checklist before entering a BTC momentum trade
Go through these before committing:
- Daily RSI above 50?
- RSI trending upward over the past 3-5 days (not just elevated from a prior move)?
- Price above the support level where the current trend started?
- Volume above the 20-day average on the recent advance?
- BTC dominance flat or rising?
- Fear & Greed between 30 and 75?
Five of six is a reasonable threshold. Three or fewer is a reason to wait. Setups that require you to rationalize half the checklist usually don't work out.
Frequently Asked Questions
What is momentum trading in crypto? Momentum trading crypto is a strategy where you buy an asset that's already rising and exit when the trend starts to slow. The core idea is that trending assets tend to continue in the short term. In BTC markets, traders typically measure momentum using RSI, volume, and price rate-of-change rather than any form of fundamental analysis.
What is a good RSI for buying Bitcoin? There's no single "good" RSI level, but many BTC traders look for entries when RSI crosses back above 40 after a dip, suggesting momentum is recovering before the broader crowd notices. RSI between 50-65 on the daily chart is generally considered the cleaner range for momentum entries. RSI above 70 means the move is already mature, which shifts the risk/reward against you.
Is RSI a reliable indicator for Bitcoin trading? Useful, not reliable on its own. RSI works better when combined with support and resistance levels, volume, and sentiment context like the Fear & Greed Index. By itself it produces too many false signals in volatile markets — you'd get chopped up trading off RSI alone.
How do I know when BTC momentum is fading? Watch for RSI making lower highs while price makes higher highs. That's called bearish divergence and it suggests the trend is losing underlying strength. Also watch for volume dropping on price advances. When BTC price rises but volume is thin and RSI is declining, the move is running out of fuel.
How is momentum trading different from buying the dip? Buying the dip is a contrarian strategy: you buy because price fell, expecting a recovery. Momentum trading is a trend-following strategy: you buy because price is rising and the trend has supporting data behind it. They're not mutually exclusive, but they require different entry criteria. A momentum trader waits for the trend to reassert itself after a pullback rather than trying to catch the exact low.
Disclaimer: This article is for educational purposes only and does not constitute financial advice. Past performance does not guarantee future results. Always do your own research before making trading decisions.
Market data via CoinGecko.