When to Take Profit on Bitcoin: A 3-Signal Exit Framework
BTC entered at $66,957 on Apr 5, exited at ~6% gain on Apr 8 as the daily Bollinger Band upper rail signaled pullback. This walkthrough covers the 3-factor exit framework: Bollinger Bands, macro risk, and return benchmarking.
When to Take Profit on Bitcoin: A 3-Signal Exit Framework
Most traders spend all their energy on the entry. When to buy, what the signal says, whether RSI confirms, what Fear & Greed looks like. Then the position moves in their favor and they freeze. Hold too long and a 6% gain turns into a 1% gain. Exit too early and you're watching BTC run another 10% without you.
Getting the exit right is harder than the entry. Here's the framework we use, illustrated with a real trade that closed last week.
TL;DR
- BTC entered at $66,957 on April 5, 2026 on a signal that flagged a downtrend breaking above resistance.
- The position closed April 8 at approximately $70,975, a 6% return on spot BTC over 3 days.
- Three factors triggered the exit: Bollinger Band upper rail on the daily, unresolved macro risk (US-Iran), and hitting our target return of ~6%.
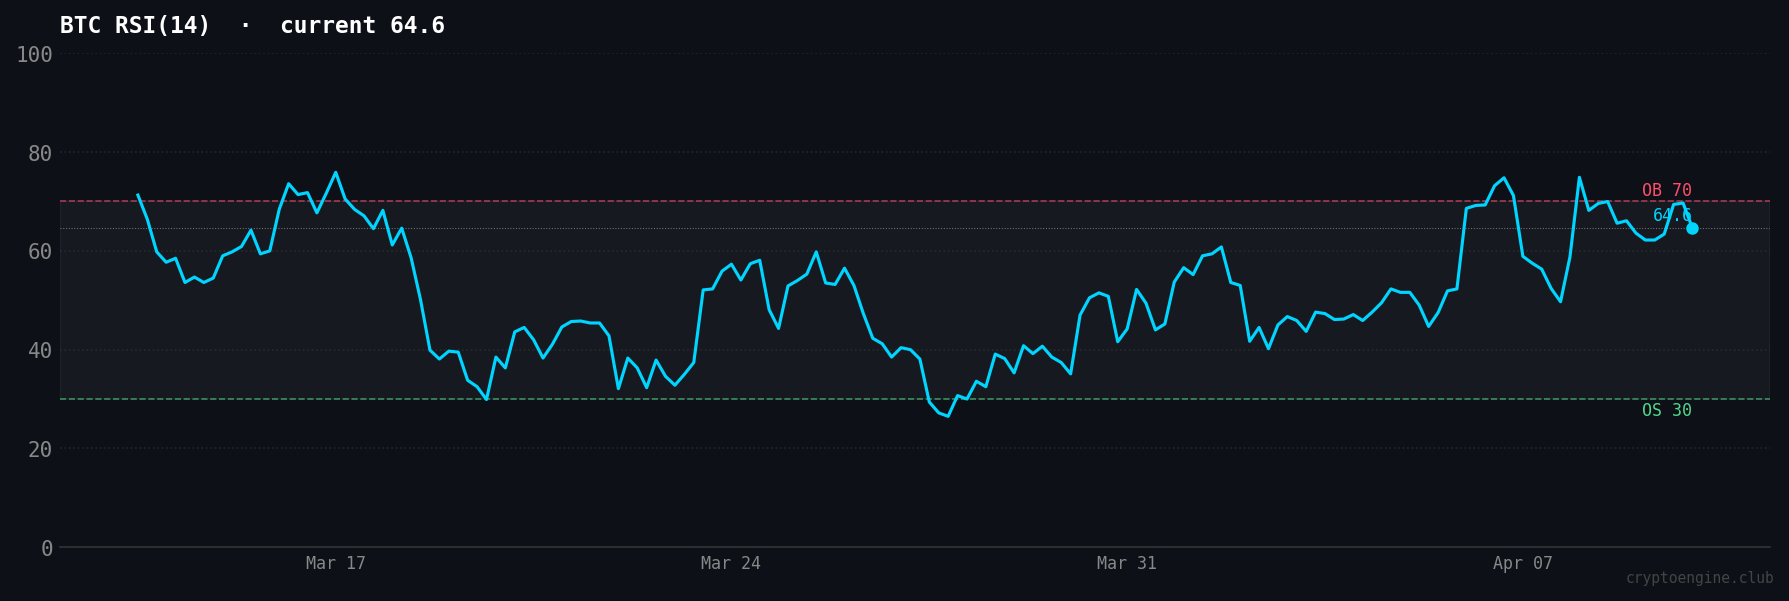
- The Fear & Greed Index reads 16 (Extreme Fear) as of April 10, and BTC RSI(14) sits at 64.6, neutral and not yet overbought.
- Knowing when to exit protects gains that compounding can turn into meaningful returns over multiple signals.
What Does "Take Profit" Actually Mean in BTC Trading?
A take-profit exit is a planned close of a position at a price level where you've locked in a gain. The key word is planned. Traders who exit on emotion, driven by greed, panic, or gut instinct, tend to either give back gains or exit before a move fully develops.
A take-profit target is a price or condition at which your original thesis has played out and the risk/reward for staying in the trade has shifted against you.
That last part is what most guides skip. Having a target price isn't enough. You need to know why that price is the right exit, so you can adjust when the market doesn't follow the script.
How Do Bollinger Bands Signal That a Move Is Running Out of Steam?
Bollinger Bands place two bands around a 20-period moving average: one set 2 standard deviations above, one set 2 standard deviations below. When price touches or breaches the upper band on the daily chart, it means the move has extended to a statistically rare level. That doesn't mean BTC will immediately reverse, but it does mean the easy part of the move is likely done.
On April 8, BTC's daily candle touched the Bollinger Band upper rail after running from $66,957 to roughly $70,975, a clean 6% extension off the signal entry. When price touches the upper band, a pullback to the middle band (the 20-period SMA) is the normal outcome. That pullback could be mild or it could wipe out half your gains, depending on what's driving the move.
The chart below shows the full position: entry on April 5, the run to the upper band, and the exit on April 8 before the anticipated pullback.
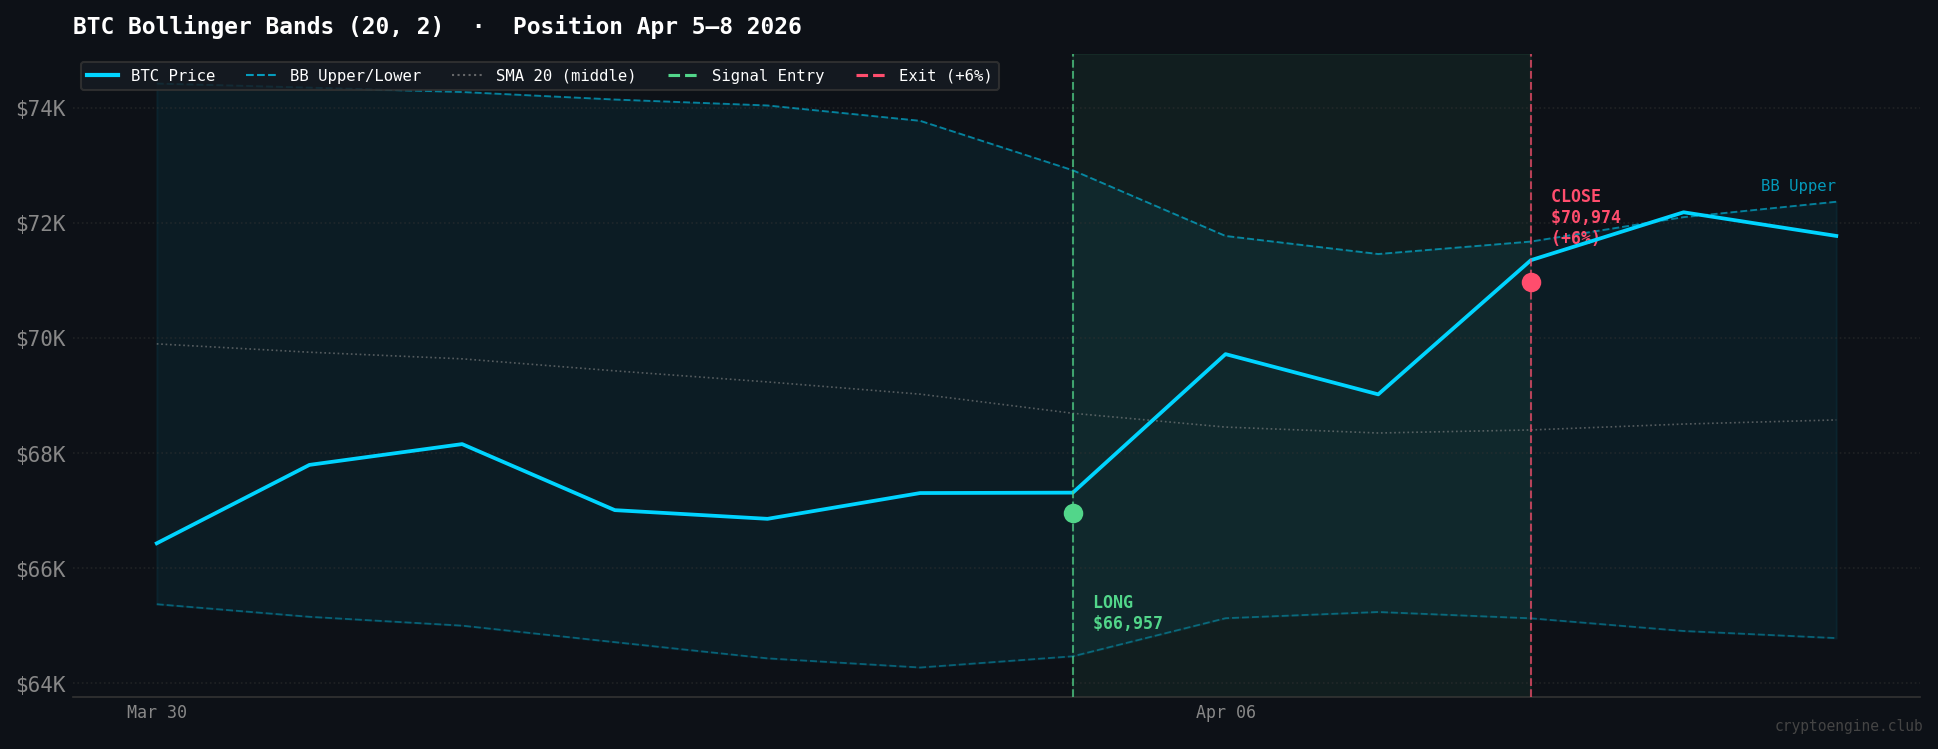
The shaded green zone marks the holding period. Notice how the exit landed right as price approached the upper band, not after it bounced off, but as it arrived. That's the right timing. Waiting for confirmation of the reversal usually costs you 1–2% of your gain.
A Bollinger Band touch alone is not always a reason to exit. It's a warning. You need at least one other factor confirming the decision.
The April 5–8 Trade: How the Exit Decision Actually Worked
On April 5, the CryptoEngine signal flagged a long entry at $66,957. The rationale: downtrend breaking above resistance. Price had been sliding and punched through a level that had been holding as ceiling. The signal is designed to capture the continuation move off that break.
Three days later, we closed the position. Here's what drove that call.
The daily chart hit the Bollinger Band upper rail at approximately $70,975. A normal pullback from there would bring price back toward the 20-SMA, easily a 2–3% drop from the exit level.
The macro picture complicated things. US-Iran tensions were still unresolved, and oil had moved close to a key support level. When geopolitical uncertainty lingers and oil is near support, the risk of a sudden risk-off event goes up. Macro shocks don't care about your technical setup. Holding through that with a 6% floating gain made no sense.
Then there was the return itself. Our target was ~6% on spot BTC, based on the CryptoEngine signal's historical average of 6.2% per trade. When you've hit your target, the argument for staying in weakens. You've captured what you came for, and the remaining upside comes with increasingly bad odds.
None of these signals alone was a slam-dunk exit. Together, they were clear enough.
Why Does the RSI Reading Matter at Exit Time?
RSI at exit is about understanding how much runway is left in a move. If RSI is 80+ when you're considering an exit, price is in overbought territory and a correction is likely imminent. If RSI is 55, the move has room to continue, which might argue for holding.
At the time of the April 8 exit, RSI(14) was heading toward the mid-60s. Neutral territory, not overbought. That meant BTC still had technical room to move higher, which is why the Bollinger Band upper rail and macro context were the heavier weights in the exit decision.
The RSI chart below shows the current reading of 64.6, still neutral as of April 10, consistent with BTC continuing to recover post-exit.
After the exit, BTC continued higher to $71,902. That's fine. The goal isn't to exit at the absolute top. It's to exit with the gain you came for, before the risk/reward flips against you.
What Are the Most Common Mistakes Traders Make When Taking Profit?
The first one is anchoring on a round number. Traders fixate on $70,000 or $75,000 as a psychological target, then hold through a reversal trying to reach it. Round numbers are not technical levels. Your exit should be based on where the chart says the move is done, not where a round number happens to sit.
The flip side is panic-selling a 3% gain because you're afraid of giving it back. If your technical framework doesn't show a reason to exit, don't exit. A 3% gain in a position that has room to run to 8% is an early exit, not a good one. Having a defined target return helps here. You know when 6% means you're done versus when it's only halfway to where you planned to exit.
The third trap is ignoring macro context entirely. A lot of BTC traders trade the chart and nothing else. That works fine in stable environments. It breaks down when geopolitical events or oil price moves trigger sudden risk-off selling. Macro doesn't need to be complex. Just ask: is there an unresolved event in the next 48 hours that could spike volatility and wipe out your gain? If yes, your risk/reward just shifted.
How It All Fits Together
A solid BTC exit doesn't come from a single trigger. It comes from a few things lining up at the same time.
Start with the chart. Is price hitting a meaningful resistance level? A Bollinger Band upper rail, a prior swing high, a major moving average. If yes, the move may be running out of room.
Then check macro. Is there an unresolved event in the near term that could trigger risk-off selling before your technical target plays out? Geopolitical tensions, central bank decisions, correlated asset moves. Any of these raise the cost of staying in a position.
Then check your return against your target. If you've hit what you planned to capture when you entered, the argument for holding weakens with every additional percent you're chasing.
The April 5–8 trade hit all of this: Bollinger upper on the daily, unresolved macro risk, and a 6% return matching the signal's historical average of 6.2%. Any two of those is a solid exit signal. All three together is clear.
If you prefer to have these signals tracked automatically rather than monitoring charts manually, CryptoEngine's AI signals include specific entry, stop-loss, and take-profit levels with each call. See how the signals are structured →
Frequently Asked Questions
When should you take profit on a Bitcoin trade? Take profit when at least two conditions align: a technical resistance level (like the Bollinger Band upper rail), a macro risk event that could spike volatility before your target, or hitting the return you set when you entered the trade. Waiting for all three to be perfect usually means you give back part of your gain.
What is the Bollinger Band upper rail in crypto trading? The Bollinger Band upper rail is the top boundary of the Bollinger Band indicator, set 2 standard deviations above the 20-period moving average. When BTC's daily candle touches this level, it signals the price move has extended to a statistically uncommon point. A pullback toward the middle band (the SMA) is the typical next move.
How do I know if 6% is a good return for a BTC trade? It depends on your target going in. A 6% return in 3 days on spot BTC is strong. CryptoEngine's signals average 6.2% per trade, so 6% is right at target. If you hit your number, taking it and closing is disciplined, not conservative. What matters is consistency across many trades, not squeezing the maximum from any single one.
Can you exit a BTC trade before it hits your take-profit target? Yes, and sometimes you should. If macro risk rises or technical conditions change after entry, adjusting your exit early is disciplined risk management, not giving up. The goal is to protect the gain you came for, not to prove you picked the exact top.
Disclaimer: This article is for educational purposes only and does not constitute financial advice. Past performance does not guarantee future results. Always do your own research before making trading decisions.