Bitcoin at $62,681, Fear at 23: July 5 Signal Recap | Crypto Engine Research
CryptoEngine's July 1 LONG entered at $60,415, now up 3.8% with BTC at $62,681. Fear & Greed sits at 23 (Extreme Fear) despite a +4.8% weekly gain. Signal win rate is 10/10 across the last 10 completed signals.
Bitcoin at $62,681, Fear at 23: July 5 Signal Recap
BTC recovered off its late-June lows and is trading at $62,681 as of July 5, 2026, up 4.8% on the week. This BTC signal recap July 2026 covers the active LONG signal, the ongoing fear-price split, and what the technical picture looks like heading into the second half of July. The CryptoEngine LONG signal issued July 1 at $60,415 is up 3.8% from entry. What makes this week unusual: the Fear & Greed Index reads 23 (Extreme Fear) even as Bitcoin climbed 4.8% on the week. Price and sentiment are pulling in opposite directions. That gap is worth watching.
TL;DR
- CryptoEngine's July 1 LONG signal entered at $60,415 and is up 3.8%, with BTC now at $62,681 as of July 5, 2026.
- The Fear & Greed Index reads 23 (Extreme Fear), even as BTC gained 4.8% over the past 7 days.
- BTC RSI(14) sits at 59.9 (Neutral), well short of overbought territory at 70+.
- The signal service has gone 10/10 correct on 5-day returns across the last 10 completed signals.
- Bitcoin dominance holds at 55.6%, while ETH surged 12.2% on the week to $1,773.
Key Numbers This Week
| Metric | Value | Change |
|---|---|---|
| BTC Price | $62,681 | 🟢 +4.8% (7d), 🔴 -0.3% (24h) |
| Fear & Greed | 23 (Extreme Fear) | — |
| BTC RSI(14) | 59.9 (Neutral) | — |
| BTC Dominance | 55.6% | — |
| ETH Price | $1,773 | 🟢 +12.2% (7d) |
| CryptoEngine Signal | LONG | — |
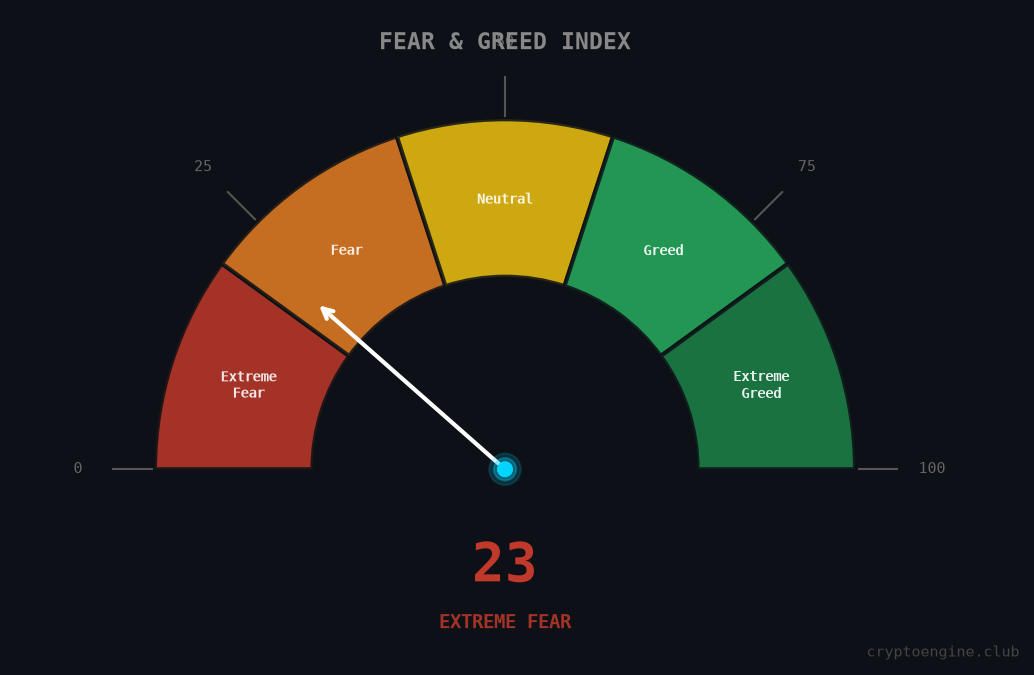
Sentiment is deep in Extreme Fear territory, as the gauge below shows:
How the signal has performed
The most recently completed signal was a SHORT issued June 30. It returned +0.1% over 5 days. Not much of a move, but the direction was right: BTC hovered in the upper $50,000s during that window before catching a bid.
Earlier signals ran further. The June 28 SHORT returned +1.1% at 5 days. The June 24 SHORT returned +4.3%. The June 18 SHORT returned +0.8% at 5 days and +7.4% at 10 days, as BTC spent most of that period pinned below $64k before its recent recovery.
The current LONG has been active since July 1. CryptoEngine entered at $60,415 on a "downtrend breaking above resistance" signal, and BTC has since moved to $62,681 for a +3.8% return since entry. The 5-day win rate across the last 10 completed signals is 10/10. That pace won't continue indefinitely, but it's what the data shows right now.
If you want the Q2 track record in full, the Q2 2026 signal performance review covers every completed signal from April through June with entry and exit prices.
What does extreme fear at 23 mean when BTC is rising?
Extreme Fear at 23 while BTC prints a 4.8% weekly gain is an unusual combination. Fear typically goes with selling, which drives price lower. Here, BTC bounced hard off its late-June lows and sentiment hasn't caught up.
Two reads on this. One: fear is lagging. The index still reflects the June selloff; markets moved before the crowd updated their read. A market climbing a wall of worry can keep climbing until retail returns. Two: the lack of retail enthusiasm means weak hands haven't come back yet, which means they aren't selling into strength either. That can be a quiet positive for continuation.
Neither interpretation is a certainty. What the Fear & Greed reading does tell you: retail isn't buying this bounce aggressively. Whether that's a setup for more upside or a preview of another leg down depends on where BTC goes from the $62k-$63k zone.
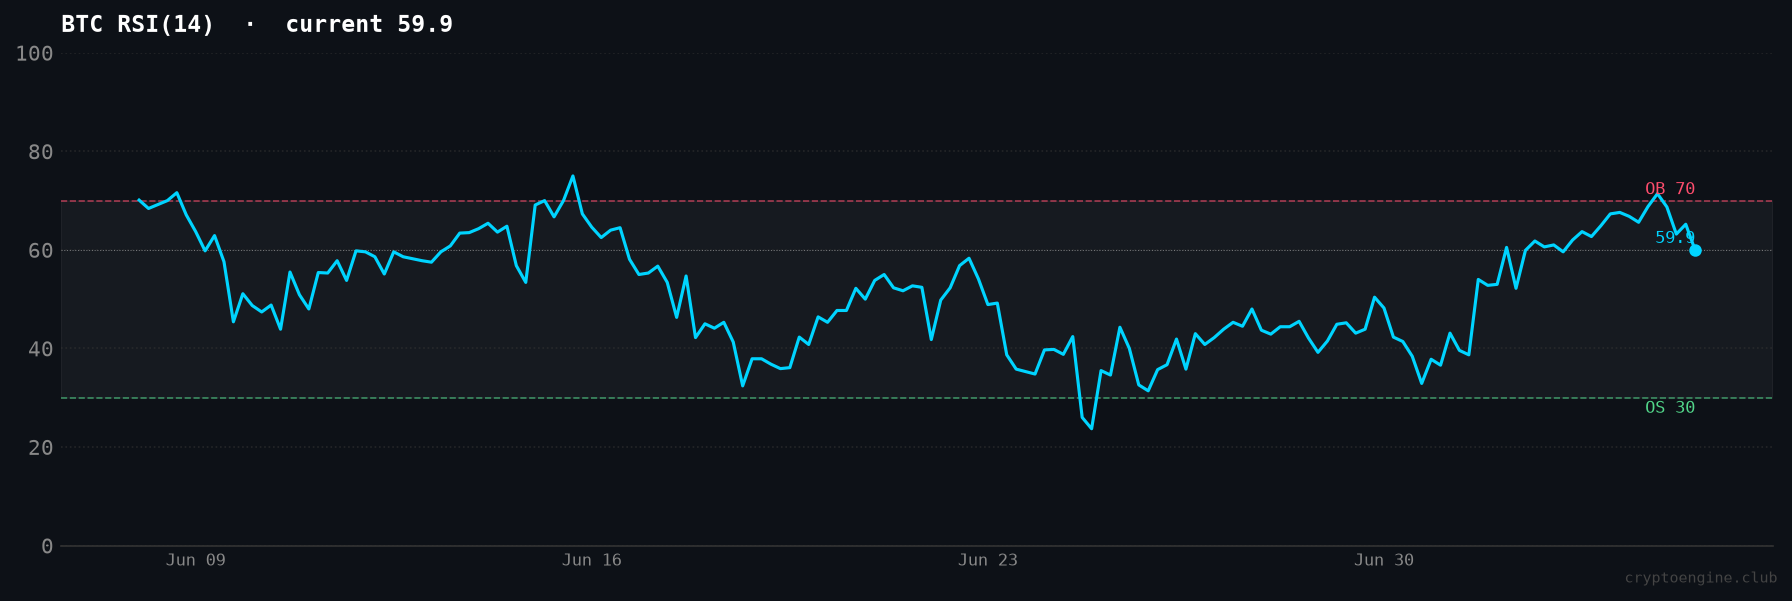
RSI at 59.9 is the more reassuring data point. Neutral, not overextended. BTC has room to run before momentum signals overheating.
Is the BTC-stocks disconnect going to resolve, and how?
CoinDesk noted this week that BTC's divergence from record-high equities "won't last." Analysts at Decrypt flagged rising exchange deposit volumes as a potential warning: historically, that's a precursor to sell pressure, not a sign of accumulation.
Bitcoin dominance at 55.6% is holding. ETH's 12.2% weekly gain is notable but hasn't broken BTC's grip on flows yet. A sustained rotation toward alts usually means BTC has moved first and confidence is spreading downstream. Whether this week's ETH pop signals that or just reflects short-covering in beaten-down altcoins is hard to say.
The $62k-$63k zone is the structural level to watch. It was resistance heading into the late-June drop; it's now flipped support. If BTC holds above it through the weekend, the downside thesis weakens considerably. A break back below $62k, combined with continued elevated exchange deposits, would change the picture fast.
Ready to trade on a specific signal rather than a broad market read? See how CryptoEngine's signals work and what the current LONG entry looks like.
What to watch next week
The $62k floor matters more than any single news headline right now. The current LONG trade entered at $60,415 — a close back below $62k would start compressing the trade's cushion.
Exchange deposits are elevated. Decrypt's analyst note this week wasn't a prediction, but elevated exchange inflows ahead of a sentiment rebound have preceded near-term corrections before. If that plays out, $59,000-$60,000 is the zone where the last several signals fired and where a new entry might set up.
The Fear & Greed reading is the one to track daily. A move back toward 30-40 would show sentiment catching up to price, which tends to add fuel to a rally already underway. If it drops back below 20, that's a warning to tighten stops rather than add exposure.
For the prior week's context, see the June 28 recap, which covers the signal sequence through the June selloff.
Frequently asked questions
What is the CryptoEngine signal for July 2026? The active signal in this BTC signal recap July 2026 is LONG, issued July 1 at an entry price of $60,415. BTC is trading at $62,681, representing a +3.8% return since entry. The signal fired on a "downtrend breaking above resistance" pattern and no exit has triggered.
Why is the Fear & Greed Index at 23 when BTC just gained 4.8%? Sentiment typically lags price in the short term. The Extreme Fear reading reflects residual anxiety from the late-June selloff rather than current market conditions. RSI at 59.9 shows BTC momentum has improved even as trader confidence hasn't caught up yet. These divergences usually resolve, either by price pulling back to match sentiment or sentiment climbing to match price.
What does BTC dominance at 55.6% mean this week? Bitcoin dominance is the percentage of the total crypto market cap held in BTC. At 55.6%, Bitcoin is still absorbing most of the inflows. ETH gained 12.2% this week, but that hasn't broken BTC's share yet. A sustained drop in BTC dominance below 52-53% would signal a broader alt rotation.
Is the CryptoEngine LONG signal still open as of July 5? Yes. The signal was issued July 1 at $60,415 and is currently up 3.8% based on today's BTC price of $62,681. No exit has been triggered.
What has the recent signal win rate been? 10/10 correct on 5-day returns across the last 10 completed signals as of July 5, 2026. The most recent completed signal, a SHORT from June 30, returned +0.1%, while the June 24 SHORT returned +4.3% and the June 18 SHORT extended to +7.4% at 10 days.
Disclaimer: This article is for educational purposes only and does not constitute financial advice. Past performance does not guarantee future results. Always do your own research before making trading decisions.