Bitcoin Trading Signal Performance: What Q2 2026 Shows | Crypto Engine Research
From April 1 to June 28, 2026, BTC fell 11.66% while CryptoEngine's timing strategy returned +10.57%, a 22.23 point edge. Across the last 10 completed signals, all 10 were correct at the 5-day mark. A track record is evidence, not a promise of what comes next.
Bitcoin Trading Signal Performance: What Q2 2026 Shows
Most people judge a signal service on its last call. That is the wrong lens. One trade tells you almost nothing. A quarter of trades, logged and dated, tells you something real.
Bitcoin trading signal performance is the measured return of a signal service's calls over time, tracked against a benchmark like buy-and-hold BTC. From April 1 to June 28, 2026, that benchmark was ugly. BTC ran up to roughly +19% by mid-May, then rolled over and closed the period down 11.66%. Anyone who bought in early April and held did worse than break-even.
CryptoEngine's BTC timing strategy finished the same window at +10.57%. That is a 22.23 percentage point gap between the strategy and the coin it trades. This piece walks through what produced that gap, how the individual signals actually performed, and where a track record like this stops being useful.
TL;DR
- From April 1 to June 28, 2026, BTC fell 11.66% while the CryptoEngine timing strategy returned +10.57%, a 22.23 point spread.
- The edge came from June, when the strategy went SHORT into the breakdown that dragged BTC from the mid-$70Ks down under $60,000.
- Across the last 10 completed signals, all 10 were correct at the 5-day mark, with an average 5-day return of 6.2% per signal.
- The June 2 SHORT returned +10.5% at 3 days; the May 28 SHORT returned +19.1% at 10 days.
- A 3-month, 10-signal sample is evidence of a process working, not proof of what the next call does.
Why a signal track record matters more than a hot tip
A single winning call is noise. Anyone can be right once. The reason performance history matters is that it shows whether a process repeats, and whether it holds up when the market turns against the obvious trade.
Q2 2026 was a good stress test because the easy read was wrong. BTC spent six weeks climbing. By mid-May it was up around 19% from the April 1 level, and sentiment was leaning greedy. The buy-and-hold crowd felt smart. Then the market reversed hard and gave all of it back and more.
A strategy that only works when BTC goes up is not a strategy. It is a leveraged bet on direction. What you want to see from a track record is whether the calls adapted when the trend broke. That is exactly the moment most retail traders freeze, average down, or sell the bottom.
What do CryptoEngine's Q2 2026 numbers show?
The chart below plots the two paths over the full period: BTC buy-and-hold in red, the timing strategy in green.
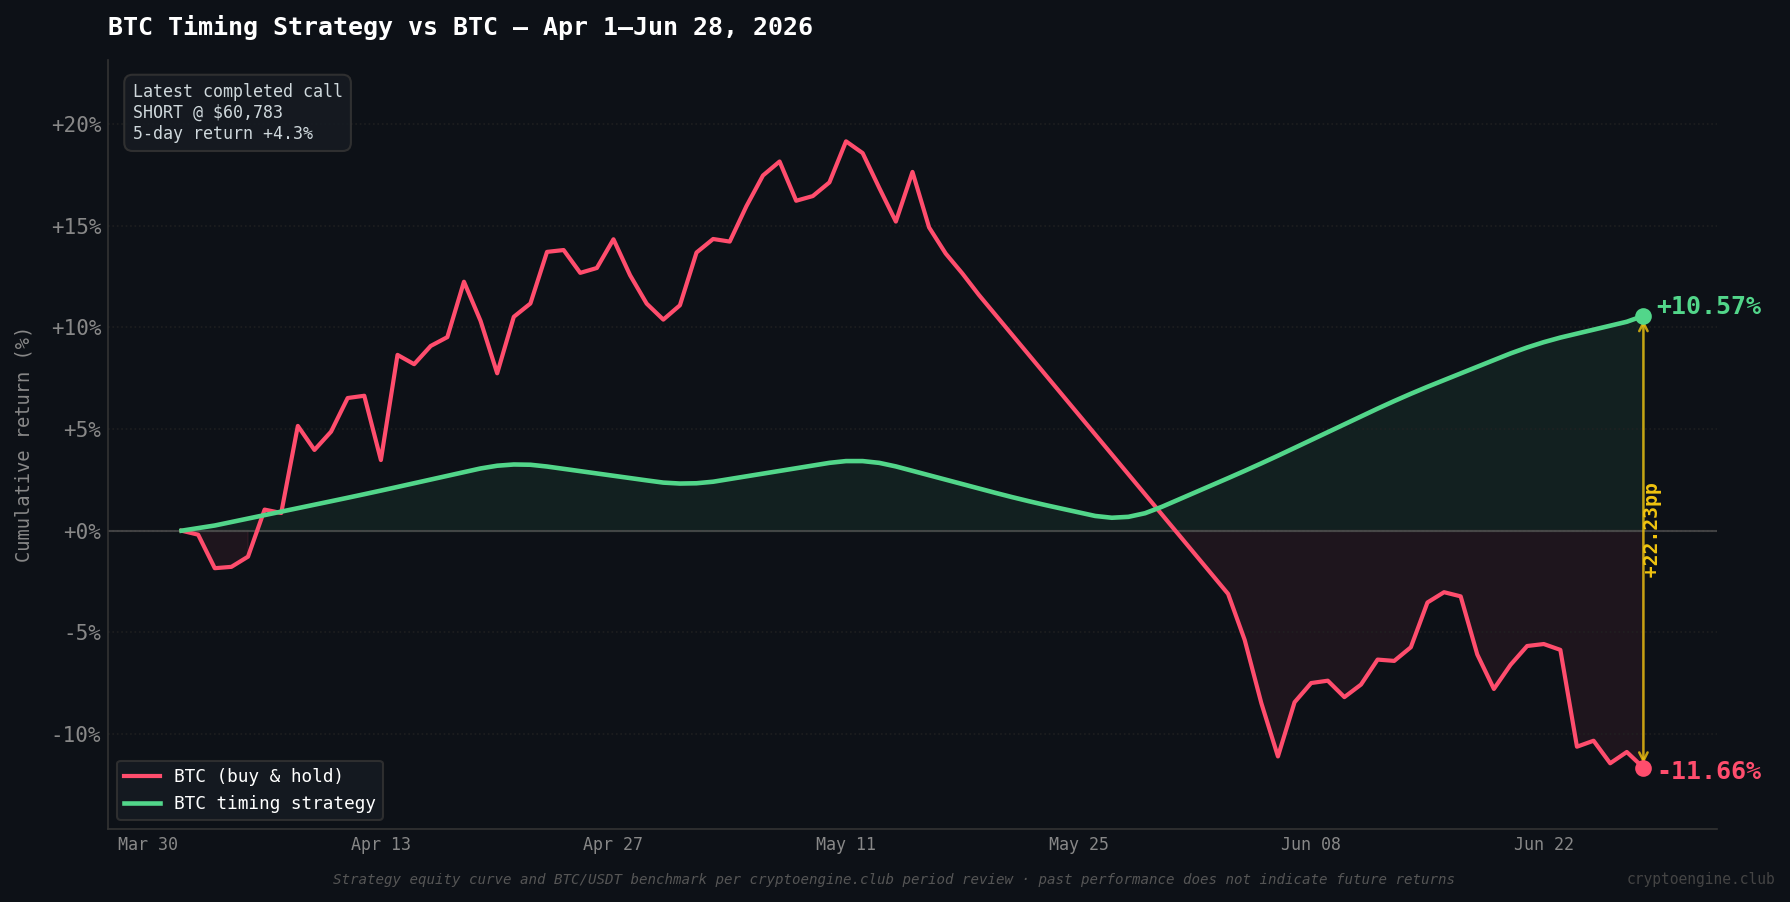
Two things stand out. First, the strategy did not try to out-run BTC on the way up. Through April and early May it stayed modest, well below BTC's rally. That looks like underperformance if you stop watching in mid-May.
Second, the divergence happened on the way down. As BTC topped and started falling, the strategy flipped short and the green line climbed while the red line collapsed. The full-period result: strategy +10.57%, BTC -11.66%.
The 22.23 point gap is not from calling the top perfectly. Nobody does that. It is from not being long into a 30% drawdown, and from being positioned for the move that actually happened.
How did the recent signals perform?
Aggregate numbers are easy to spin, so here are the individual calls. Returns are server-computed from each signal's entry price over 3, 5, and 10 trading days.
| Signal Date | Direction | 3d Return | 5d Return | 10d Return |
|---|---|---|---|---|
| 2026-06-24 | SHORT | +4.3% | +4.3% | +4.3% |
| 2026-06-18 | SHORT | +0.8% | +1.0% | +7.4% |
| 2026-06-08 | LONG | +0.3% | +1.6% | +6.0% |
| 2026-06-02 | SHORT | +10.5% | +10.5% | +10.5% |
| 2026-05-28 | SHORT | +0.5% | +9.6% | +19.1% |
Across the last 10 completed signals, the 5-day win rate was 10 out of 10 correct, and the average 5-day return per signal across the tracked history is 6.2%.
The June 2 SHORT is the cleanest example: +10.5% in three days as BTC dropped. The May 28 SHORT kept working out to +19.1% at 10 days. The June 8 LONG is worth noting too, because it shows the model is not permanently bearish. It took a long, caught a bounce, and booked +6.0% at 10 days before conditions flipped back to short.
Not every call is a home run. The June 18 SHORT only returned +1.0% at 5 days before the move extended later. A signal that returns less than 1% in a week is barely worth the fee on its own. The point of the record is the distribution, not any single line.
Is the active signal a win yet?
No, and this distinction matters. As of the June 28 period close, the active signal was a SHORT that fired June 24 at an entry of $60,783, with BTC trading at $59,765. That is an open position up about 1.7% in the strategy's favor, not a closed win.
An open trade is an unrealized number. It can give the gain back before there is an exit. Any service that counts open positions as victories is padding its record. The completed-signal table above is what actually happened and closed out. The June 24 SHORT only becomes a logged result once the position is exited.
This is the difference between a signal process and a highlight reel. CryptoEngine's signal approach treats each call as a dated trade plan with an entry, a stop, and a target, then logs the outcome whether it wins or loses. Plans start at $8.25/month.
Do bitcoin trading signals actually beat buy-and-hold?
Sometimes, in specific conditions, and the Q2 2026 window was one of them. When BTC trends cleanly up, buy-and-hold is hard to beat and a timing strategy that sits out part of the rally will lag. That happened here through mid-May.
The advantage shows up in choppy and falling markets. A strategy that can go short, or step aside, avoids the full drawdown that buy-and-hold eats. Over April to June, BTC's round trip from +19% to -11.66% was exactly the kind of market where timing separates from holding.
So the honest answer is conditional. Signals do not beat buy-and-hold every quarter. They earn their edge when the market stops going straight up, which is most of the time. For a fuller comparison of the two approaches, see crypto trading signals vs manual trading.
Common mistakes when reading signal performance
The first mistake is judging the whole service on one call. The June 18 SHORT returned only +1.0% at 5 days. If that was the first signal you ever saw, you might quit. The May 28 and June 2 SHORTs returned +19.1% and +10.5%. If those were your first, you might over-trust it. Neither reaction is right. Ten dated trades tell you more than any one of them.
The second is confusing an open position with a closed result. The June 24 SHORT is up 1.7% on paper. It is not booked. Traders who treat unrealized gains as locked-in profit tend to hold past the exit and watch winners turn into losers. Track what closed, not what is floating.
The third is ignoring position size. A +10.57% strategy return means nothing if a single bad trade can wipe your account. Performance history only matters if you are sized to survive the losing calls, and there will be losing calls. The 1% risk rule is the boring part that makes the win rate usable.
How the track record fits into a real trade decision
Numbers alone do not tell you what to do next Tuesday. Here is how the pieces connect using the period data.
The strategy went and stayed short through most of June because market structure was breaking, not because of one indicator. BTC was making lower highs off the mid-May top. Support levels kept failing, which is the reason logged on the June 24 signal: "Downtrend falling below support." Fear and Greed sat in Extreme Fear, in the teens, which historically sits closer to a bottom but can persist for weeks while price keeps sliding.
Put together, a strong short record plus a broken structure plus deep fear does not equal "go all in short." It equals "the sellers still have the edge, size accordingly, and wait for the exit trigger rather than guessing the bottom." The track record raises your confidence in the process. It does not remove the need for a stop.
Frequently Asked Questions
What is bitcoin trading signal performance? It is the measured return of a signal service's calls over time, usually tracked against buy-and-hold BTC as a benchmark. Good performance reporting logs every completed signal with its entry price and return, wins and losses alike, rather than showcasing only the best calls.
How did CryptoEngine's signals perform in Q2 2026? Over April 1 to June 28, 2026, the timing strategy returned +10.57% while BTC fell 11.66%, a 22.23 percentage point gap. Across the last 10 completed signals, all 10 were correct at the 5-day mark, with an average 5-day return of 6.2% per signal.
Do trading signals beat holding Bitcoin? Not always. When BTC trends cleanly higher, buy-and-hold is tough to beat. Signals earn their edge in choppy or falling markets, where the ability to go short or step aside avoids the full drawdown. Q2 2026 was a down period, which is why the strategy outperformed.
Is a strong win rate a guarantee of future results? No. A 10-for-10 5-day win rate over one quarter is a small sample. It is evidence that a process is working, not proof of what the next signal does. Past performance does not guarantee future results, which is why position sizing and stops still matter.
What is the difference between an active signal and a completed signal? An active signal is an open position with an unrealized return that can still change. A completed signal has been exited and its result is final. Only completed signals belong in a track record. Counting open positions as wins inflates the numbers.
Bottom line
BTC fell 11.66% in Q2 2026 and the timing strategy returned +10.57%, a 22.23 point spread that came almost entirely from being short during the June breakdown rather than long into it. The completed-signal record backs it up: 10 of the last 10 correct at 5 days, with clean winners like the +19.1% May 28 SHORT.
Read that as evidence a process works in the kind of market that punishes holders, not as a promise. The next quarter could look nothing like this one. Track what closes, size for the losses, and let the record inform your confidence without replacing your risk plan.
Disclaimer: This article is for educational purposes only and does not constitute financial advice. Past performance does not guarantee future results. Always do your own research before making trading decisions.
Market data via CoinGecko. Strategy and signal performance figures are from CryptoEngine's April to June 2026 period review.