Bitcoin at $64,128, Fear at 26: July 12 Recap | Crypto Engine Research
CryptoEngine's July 1 LONG entered at $60,415 and is up 6.1% with BTC at $64,128 on July 12. Fear & Greed reads 26 (Fear), RSI at 55.6 (neutral). The signal has captured a $3,713 move while sentiment stays bearish.
Bitcoin at $64,128, Fear at 26: July 12 Recap | Crypto Engine Research
This week's bitcoin signal recap: CryptoEngine's July 1 LONG is up 6.1% as of July 12. Bitcoin is at $64,128, the Fear & Greed Index sits at 26 (Fear), and RSI is at 55.6. BTC gained 2.2% on the week, a quiet advance that the crowd hasn't bought into yet. Fear remains elevated even as price grinds higher, and the signal is on the right side of that gap.
TL;DR
- CryptoEngine's July 1 LONG entered at $60,415 and is up 6.1% ($3,713 per BTC) as of July 12, 2026.
- Bitcoin is at $64,128, up 2.2% over the past 7 days.
- Fear & Greed Index reads 26 (Fear) as of July 12, 2026.
- BTC RSI(14) is 55.6, sitting in neutral territory.
- CryptoEngine has 10 correct calls out of 10 completed signals on a 5-day return basis.
Key Numbers This Week
| Metric | Value | Change |
|---|---|---|
| BTC Price | $64,128 | 🟢 +2.2% (7d), — (24h) |
| ETH Price | $1,821 | 🟢 +3.2% (7d) |
| Fear & Greed Index | 26 (Fear) | 🔴 Fearful |
| BTC RSI(14) | 55.6 | — Neutral |
| BTC Dominance | 56.2% | — |
| Total Market Cap | $2.29T | — |
| CryptoEngine Signal | LONG | — |
How Has the CryptoEngine Signal Performed?
The July 1 LONG called the move at $60,415 when BTC was breaking above resistance. Eleven days later, BTC is at $64,128 and the trade is up 6.1%. The 3-day return was +4.7%, the 5-day hit +6.5%, and the 10-day sits at +6.7%. Most of the gain came in the first week and has since leveled off near $64,000.
Before the LONG, CryptoEngine had a SHORT fired on June 30 at $58,519. That one returned +0.1% over 5 days, essentially flat. A tiny win, but the direction was right: BTC barely moved before reversing higher, and the algorithm flipped to LONG on July 1. Before that, the June 24 SHORT returned +4.3% as BTC slid through the low $60,000s, and the June 18 SHORT returned +7.4% over 10 days during the broader decline from the mid-$60,000 range.
The win rate across the last 10 completed signals is 10 for 10 on a 5-day return basis. That's an unusual streak. The active July 1 LONG has no exit triggered yet.
What Does Fear at 26 Signal for Bitcoin?
The Fear & Greed Index is at 26 as of July 12, putting sentiment in fear territory while BTC holds above $64,000. That gap between price and sentiment is meaningful.
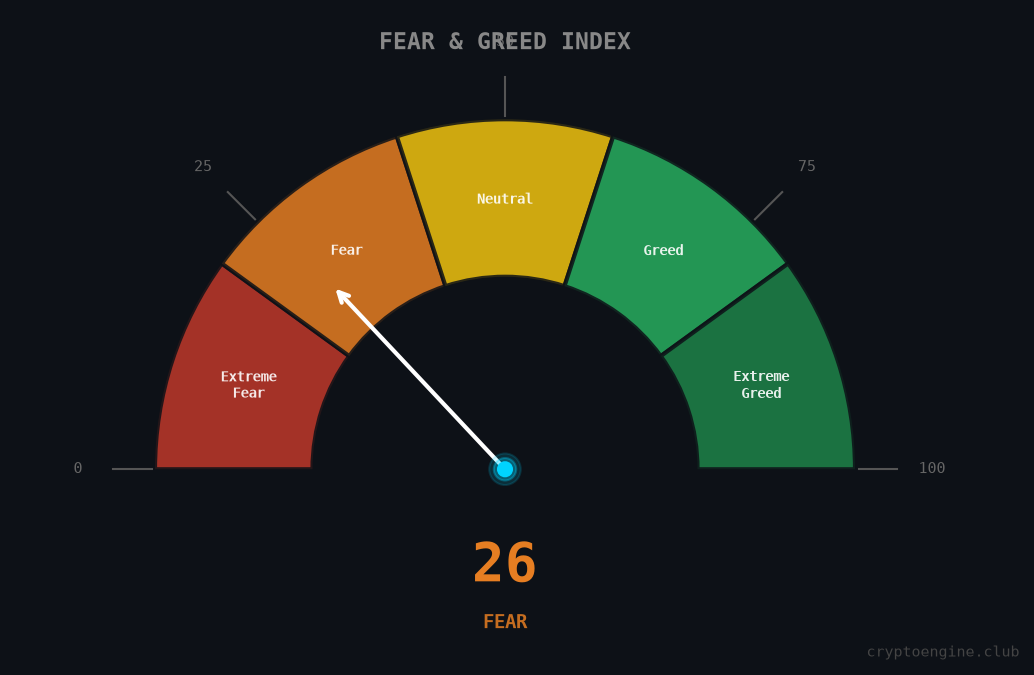
At 26, the market is cautious without being in outright panic. You'd typically need a reading below 15 to call it capitulation territory. What a reading of 26 more likely reflects is retail sitting on the sidelines, skeptical about the 2.2% weekly gain. When price rises and sentiment lags, it sometimes means the next move higher still has buyers waiting on the sidelines. But it also means the crowd won't be there to absorb a drop if price reverses.
One concrete sign of institutional appetite returning: Bitcoin and Ether ETFs snapped an eight-week outflow streak this week with $282 million in combined inflows, according to The Block. That's a data point worth watching alongside the Fear & Greed reading.
Is RSI Telling Us Anything?
BTC RSI(14) is at 55.6 as of July 12, sitting just above the neutral midpoint of 50.
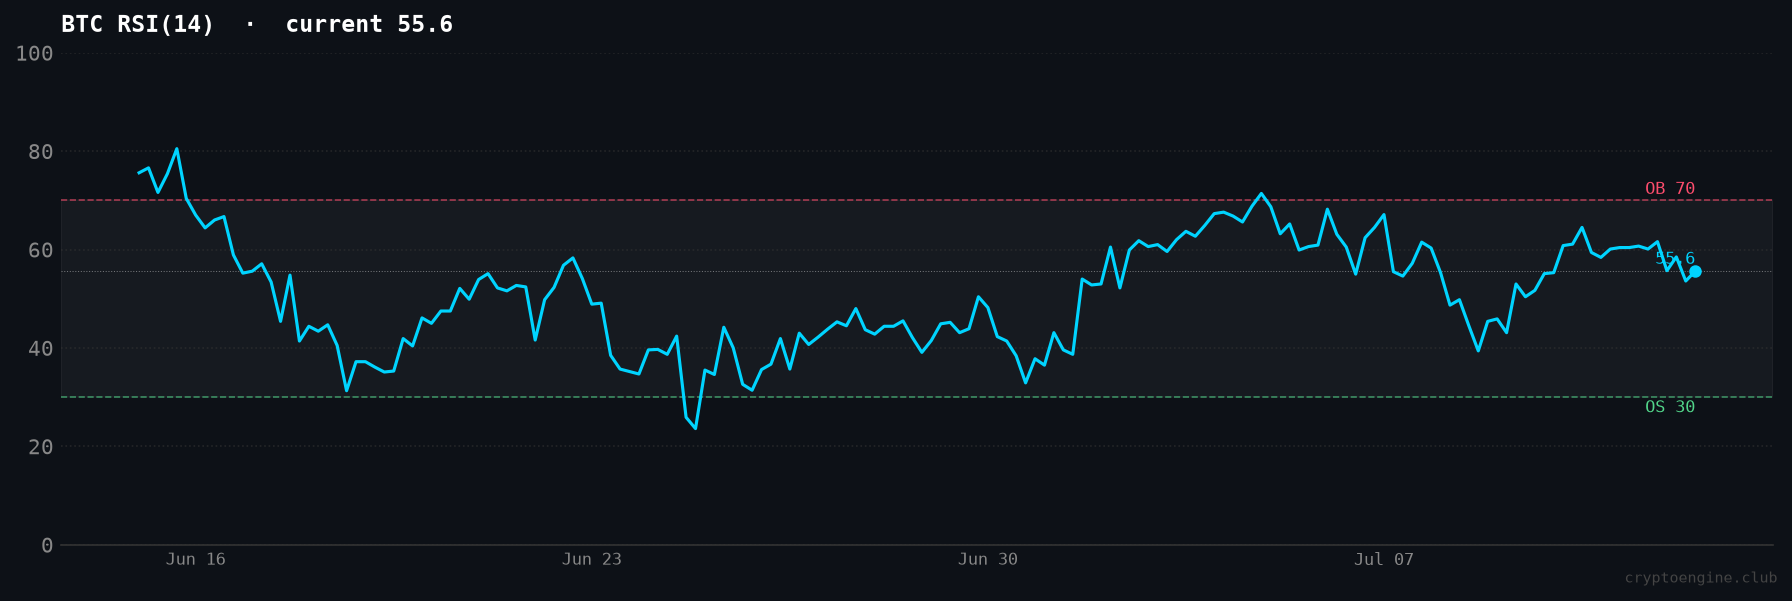
Nothing alarming here. RSI above 70 would raise questions about an overextended move; below 30 would signal oversold conditions. If you want a deeper look at how RSI works as an entry and exit tool, see our Bitcoin RSI guide. At 55.6, there's room for the LONG to run before RSI becomes a concern. The number to watch: if RSI crosses 60 on a push toward $66,000-$67,000, that would confirm momentum is still with the trade. If RSI fades back toward 50 while price stalls at $64,000, that's an early warning the move may be running out of steam.
CoinDesk noted this week that Fidelity has tracked a BTC power law support line since 2015, and Bitcoin is approaching it. If the trade starts looking stretched near $64,000-$65,000, that power law reference is the macro context to check.
What to Watch the Week of July 14
The $64,000 zone is the near-term line. BTC has been consolidating here. Holding it on any pullback keeps the LONG in good shape; losing it on volume changes the picture.
The ETF inflow break after eight weeks of outflows is a demand-side shift, but one week isn't a trend. Whether institutional buyers follow through next week is worth tracking.
The macro background has been mostly quiet. BTC and ETH were little changed after the U.S. launched fresh Iran strikes, which suggests the market isn't treating geopolitical risk as a near-term trigger right now. That can change fast, but it's not driving price at the moment.
For the full bitcoin signal recap and live exit alerts, track CryptoEngine's performance here.
Frequently Asked Questions
What is the CryptoEngine Bitcoin signal right now? CryptoEngine is running a LONG signal that fired July 1, 2026 at an entry of $60,415. As of July 12, BTC is at $64,128, putting the trade up 6.1% since entry. No exit has triggered.
What does a Fear & Greed Index reading of 26 mean? A reading of 26 puts Bitcoin sentiment in fear territory. The scale runs from 0 (extreme fear) to 100 (extreme greed). At 26, the market is cautious but not in full panic. Extreme fear typically means readings below 15.
Is BTC RSI at 55.6 a buy or sell signal? RSI at 55.6 is neutral. It sits above the midpoint of 50, indicating mild positive momentum without being overbought. Readings above 70 suggest overbought conditions; below 30 suggest oversold. At 55.6, momentum is constructive but not extreme.
How has CryptoEngine performed over its last 10 signals? CryptoEngine went 10 for 10 correct on a 5-day return basis over its 10 most recent completed signals as of July 12, 2026. Returns ranged from +0.1% (the June 30 SHORT) to +7.4% (the June 18 SHORT over 10 days).
What level should I watch for BTC this week? $64,000 is the near-term level. BTC has been consolidating there. RSI crossing above 60 on a push toward $66,000-$67,000 would confirm continued momentum for the active LONG.
Disclaimer: This article is for educational purposes only and does not constitute financial advice. Past performance does not guarantee future results. Always do your own research before making trading decisions.
Market data via CoinGecko. News sources: CoinDesk, The Block.