Bitcoin at $64,074, Extreme Fear at 18: June 14 Recap | Crypto Engine Research
CryptoEngine's June 8 LONG entered at $63,405, up 1.1% with BTC at $64,074. Fear and Greed reads 18 (Extreme Fear) while RSI holds neutral at 55.0. The prior June 2 SHORT returned 10.5% in 5 days, now 10 for 10 on recent signals.
Bitcoin at $64,074, Extreme Fear at 18: June 14 Recap | Crypto Engine Research
Bitcoin crossed $64,000 this week and held it. BTC is trading at $64,074 as of June 14, 2026, up 3.6% over the past seven days. Sentiment hasn't followed: Fear & Greed reads 18, Extreme Fear, the same zone the market was in six days ago when the current LONG signal fired. In this BTC signal recap June 2026: CryptoEngine's June 8 LONG entered at $63,405 and is up 1.1% from entry.
TL;DR
- CryptoEngine's June 8 LONG entered at $63,405 is up 1.1%, with BTC at $64,074 as of June 14, 2026.
- The prior June 2 SHORT entered at $66,316 and returned +10.5% over 5 trading days as BTC dropped to $60,165.
- Fear & Greed reads 18 (Extreme Fear) despite BTC gaining 3.6% over the past 7 days.
- BTC RSI(14) sits at 55.0 (Neutral), well above the oversold levels of early June.
- CryptoEngine has been correct on 10 of the last 10 signals, measured at the 5-day mark.
Key Numbers This Week
| Metric | Value | Change |
|---|---|---|
| BTC Price | $64,074 | 🟢 +3.6% (7d), 🟢 +0.1% (24h) |
| Fear & Greed | 18 (Extreme Fear) | — |
| BTC RSI (14) | 55.0 (Neutral) | — |
| Total Market Cap | $2.27T | 🔴 -0.1% (24h) |
| BTC Dominance | 56.6% | — |
| CryptoEngine Signal | LONG | — |
How the signal has performed
The June 2 SHORT was the last completed signal. It entered at $66,316 and returned +10.5% over five trading days as BTC dropped from the mid-$60s to $60,165 on June 6. The signal locked in that gain within three days. At the time, sentiment had collapsed to Extreme Fear and BTC was breaking below key support. The SHORT was correct.
The signal flipped to LONG on June 8, with an entry at $63,405. The system reason: "downtrend breaking above resistance." Six days in, BTC is at $64,074, up 1.1% from entry. The 5-day server-computed return is +1.6%. No exit has triggered.
Ten for ten. That's the win rate across the last 10 signals, measured at the 5-day mark. Two SHORTs during the May-June slide, a LONG in late May that ran into the breakdown, a second SHORT from June 2 that nailed the flush, and now a LONG as BTC firms up above $63K. None of those signals were wrong at the 5-day window.
That's not a guarantee for the current LONG. But it's a real track record across meaningfully different market conditions: BTC at $78K, at $60K, and now at $64K.
What does extreme fear at 18 mean when RSI is at 55?
The gap between sentiment and momentum this week is worth paying attention to. A Fear & Greed reading of 18 is the kind of number you'd expect at a capitulation bottom or during a sustained crash. RSI at 55 tells the opposite story: mid-range neutral, no oversold condition, no panic in the price structure.
As the gauge below shows, sentiment has been slow to recover even as price has stabilized:
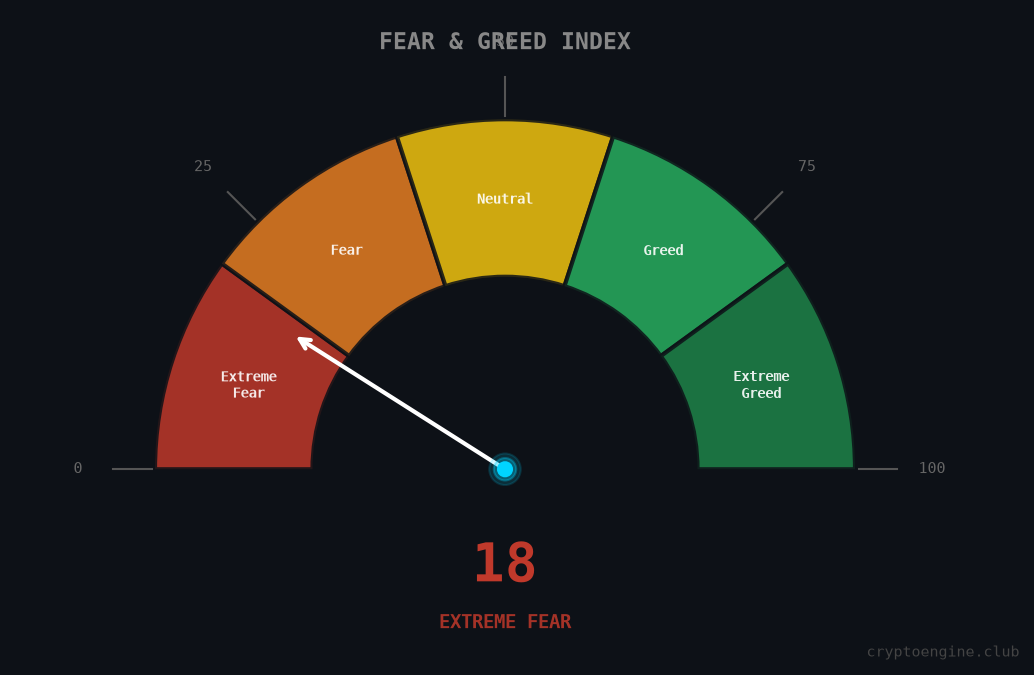
This happens when price bounces but the crowd hasn't shifted its view yet. Traders who sold near $60K aren't convinced the recovery is real, so they're sitting out or staying short. That matters for the active LONG: if sentiment starts turning from fear toward neutral, buyers who were on the sidelines can push BTC higher even from $64K.
The risk is that 18 on Fear & Greed is still a fragile reading. One macro negative, a technical rejection at resistance, or a bad ETF outflow day and the crowd that never recovered its confidence can sell again fast. The RSI gives you momentum context. The Fear & Greed number gives you crowd psychology. Right now they're not agreeing.
What drove Bitcoin's weekly gain?
BTC's 3.6% weekly gain came without a single clean catalyst. The move was gradual. Bitcoin crossed $64,000 on June 13 after Pakistan's prime minister signaled an Iran peace deal was near. Spot bitcoin ETFs snapped a five-day outflow streak on Friday with $85.8 million in net inflows, per The Block. Saylor posted that 25% of "Mag8" firms now hold BTC, citing Musk's influence on corporate adoption.
The RSI chart below shows where momentum stands after the early-June flush:
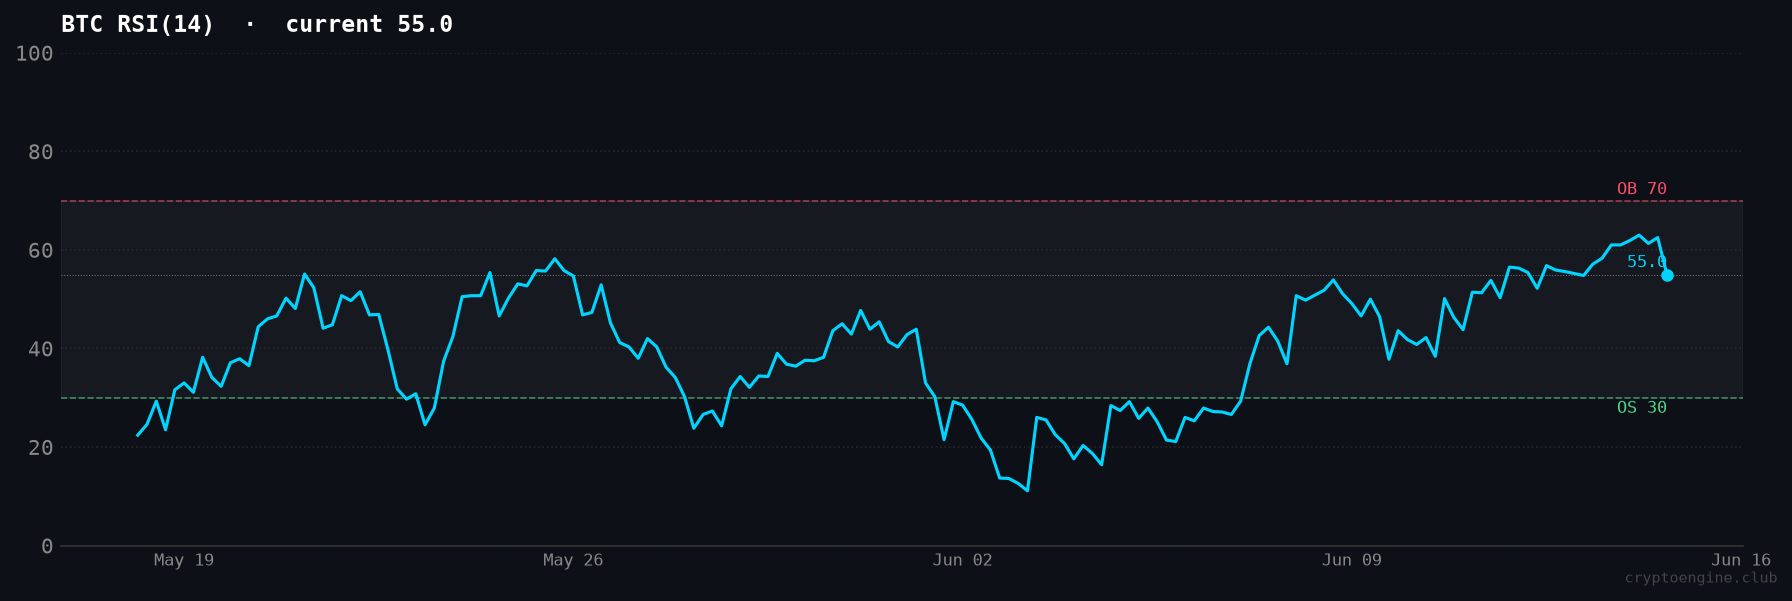
RSI recovering to 55 after the oversold conditions of early June is consistent with a technical bounce after a washout. That's not a structural reversal call. Sustained ETF inflows matter more than a single Friday's number, and volume needs to back the move.
One undercurrent worth watching: CoinDesk flagged that SpaceX's potential IPO raises questions about its $1.3 billion bitcoin reserve. If the IPO forces BTC liquidation, that's new supply. If it draws institutional attention to a company already holding a $1.3B bitcoin position, that could go the other way. Either scenario is worth tracking.
Is the active LONG signal at risk?
BTC at $64,074 is 1.1% above the June 8 LONG entry. The question is whether it holds or stalls.
BTC dominance at 56.6% means no rotation into alts has started. Capital is still parked in BTC. RSI at 55 has room to push toward overbought territory (70) before triggering a warning. Fear & Greed at 18 means no retail FOMO is baked into this move. All three give the signal room to run without hitting a technical ceiling.
The six-day price action backs this up: BTC has stayed above $62,000 every day since the signal fired, crossed $63,626 on June 12, and pushed through $64K this week. For a broader read on what that 56.6% dominance figure signals for positioning, our Bitcoin dominance breakdown has the context.
If you want to follow the current signal in real time, CryptoEngine's pricing page shows the live direction and full performance history.
Frequently Asked Questions
What is CryptoEngine's current BTC signal? CryptoEngine is currently LONG on BTC, with the signal active since June 8, 2026. The entry price was $63,405. As of June 14, BTC is trading at $64,074, putting the signal up 1.1% from entry. No exit has been triggered.
What does Fear & Greed at 18 mean for Bitcoin? A Fear & Greed reading of 18 means the market is in Extreme Fear, where selling pressure and negative sentiment dominate. Historically, readings below 20 have often preceded recoveries, though they can accompany prolonged downtrends as well. The current reading stands out because BTC is actually up 3.6% over the past week, suggesting price has recovered faster than crowd sentiment.
What is BTC's RSI reading right now? BTC's RSI(14) stands at 55.0 as of June 14, 2026, in the neutral zone. That's a meaningful recovery from the oversold levels of early June and suggests the worst of the selling pressure has cleared, though BTC hasn't reached overbought levels yet.
What's the signal track record in this BTC signal recap June 2026? The June 2 SHORT entered at $66,316 and returned +10.5% over 5 trading days as BTC dropped to $60,165. The current June 8 LONG, entered at $63,405, is up 1.1% as of June 14. CryptoEngine has been correct on 10 of the last 10 signals at the 5-day mark.
Is now a good time to buy Bitcoin? Nobody knows for certain. The data shows BTC in the neutral RSI zone, sentiment still in Extreme Fear at 18, and the active CryptoEngine LONG signal calling a trend reversal above $63K resistance. Extreme Fear readings have historically offered better entry conditions than euphoria, but past patterns are not guarantees. Size positions based on your own risk tolerance and do your own research.
Disclaimer: This article is for educational purposes only and does not constitute financial advice. Past performance does not guarantee future results. Always do your own research before making trading decisions.
Market data via CoinGecko. News sources: CoinDesk, The Block, Decrypt.