Bitcoin at $78,685, Fear at 47: May 3 Recap | Crypto Engine Research
CryptoEngine's May 1 LONG entered at $78,138 is up 0.7% with BTC at $78,685. Fear and Greed reads 47 (Neutral), RSI at 61.9. Signal accuracy sits at 1 of 5 correct over the last five calls.
Bitcoin at $78,685, Fear at 47: May 3 Recap | Crypto Engine Research
This BTC signal recap May 3 2026 starts with CryptoEngine's active LONG: open since May 1 at $78,138, up 0.7% with BTC at $78,685. Fear & Greed holds at 47 (Neutral) and RSI sits at 61.9. After a stretch of choppy, hard-to-read signals, here's where things actually stand.
TL;DR
- CryptoEngine's May 1 LONG entered at $78,138 is up 0.7% with BTC at $78,685 on May 3, 2026.
- Fear & Greed reads 47 (Neutral) and RSI is at 61.9, both mid-range after BTC's 18% 30-day climb.
- BTC is up 1.0% over 7 days and 18% over 30 days, with total market cap at $2.70 trillion.
Key Numbers This Week
| Metric | Value | Change |
|---|---|---|
| BTC Price | $78,685 | 🟢 +1.0% (7d), 🟢 +0.4% (24h) |
| Fear & Greed | 47 (Neutral) | — |
| BTC RSI(14) | 61.9 | — |
| BTC Dominance | 58.4% | — |
| Total Market Cap | $2.70T | 🟢 +0.3% (24h) |
| CryptoEngine Signal | LONG | — |
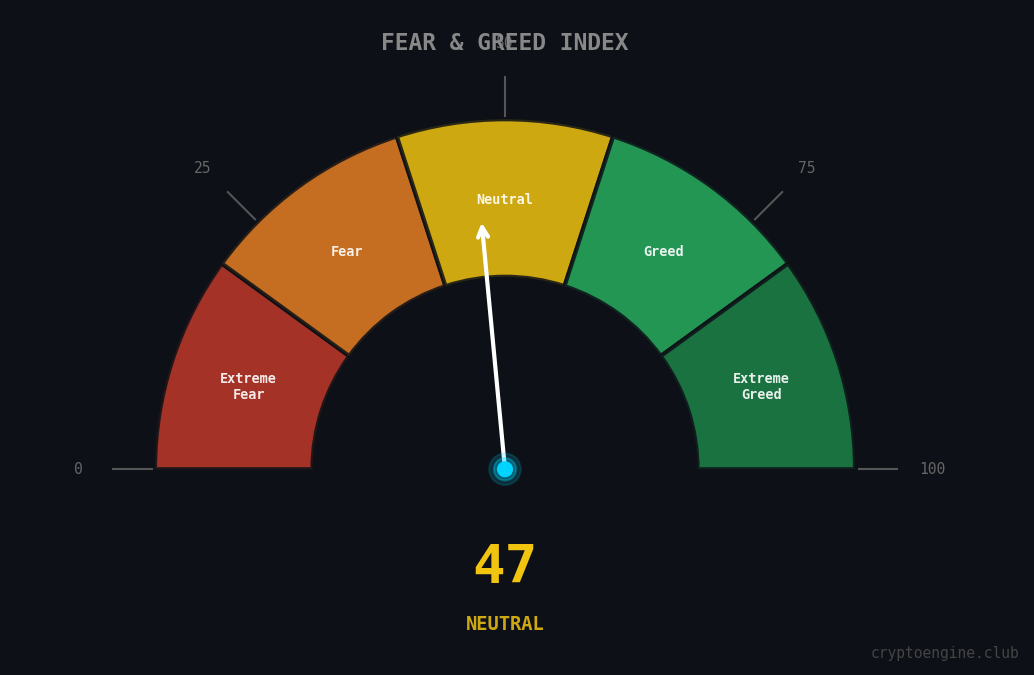
What Does Fear & Greed at 47 Mean for BTC Right Now?
Fear & Greed at 47 is a neutral reading. Not fear, not greed. Just indecision.
After BTC ran 18% over 30 days, the market has cooled off without collapsing. $78,685 is not a panic low and not a euphoria top. When sentiment sits in the 40-55 band, traders wait for a catalyst. Moves that break out of neutral territory tend to run further than moves from extreme readings, because fewer people are positioned for them.
For a deeper look at how the index has historically mapped to BTC entry points, our Fear and Greed Index guide covers the mechanics across the full 0-100 range.
BTC dominance sits at 58.4%. That's high. Capital is parked in BTC, not rotating into altcoins. When dominance is this elevated and stable, the BTC price move is where traders are focused.
Where Does BTC's RSI Stand Heading Into Next Week?
RSI(14) at 61.9 is in the upper neutral zone. Not overbought above 70, but trending that direction.
After an 18% 30-day run, an RSI near 62 is not unusual. It's elevated but not flashing overheated. If BTC keeps pushing, RSI approaching 70 is where momentum traders typically start watching for exhaustion. A pullback that holds RSI above 50 from here is actually healthy: momentum cooling without reversing.
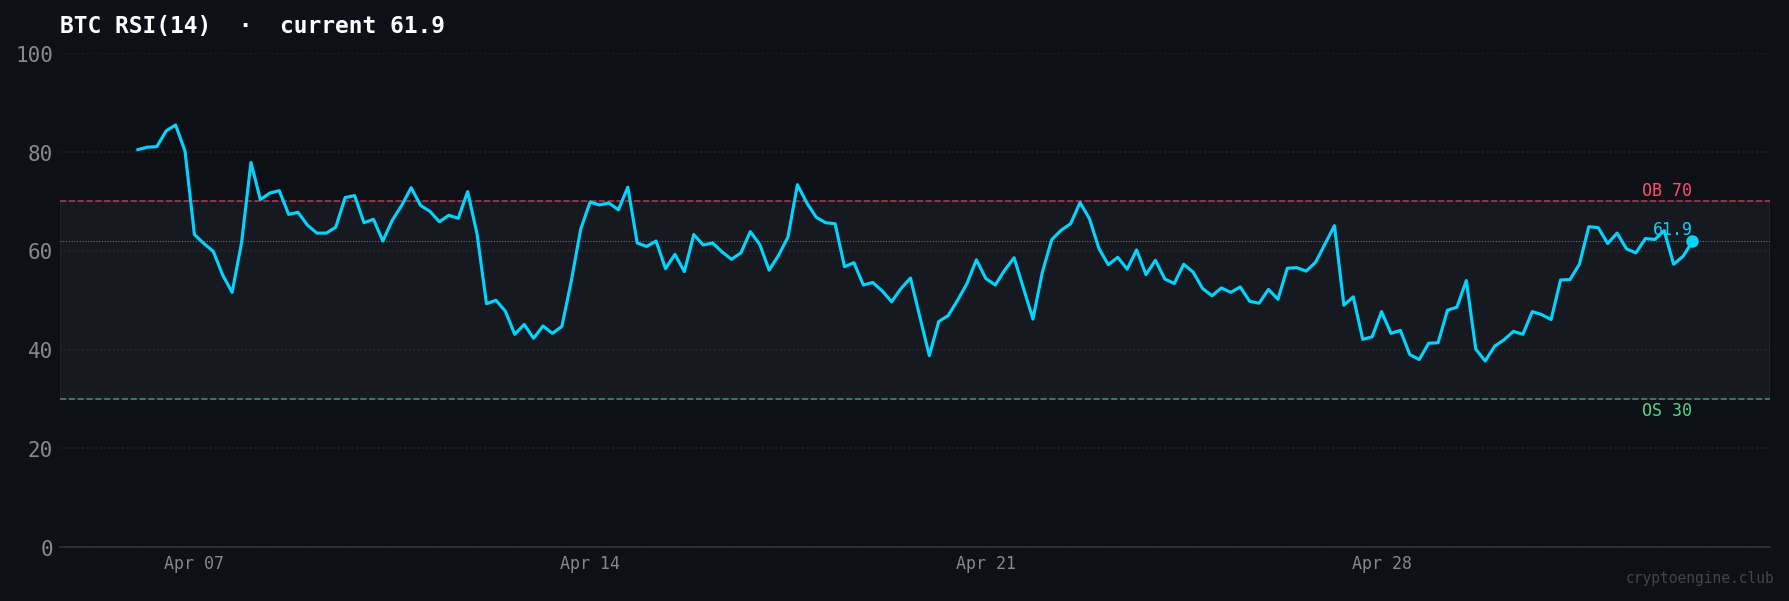
For the active LONG signal, RSI staying above 55 while BTC holds above $78,000 is a healthy backdrop. A drop below that range would shift the read.
What Happened in Crypto Markets This Week?
BTC is up 1.0% over 7 days, trading at $78,685. Total market cap is $2.70 trillion.
The week's news had a policy tilt. The Senate cleared the CLARITY Act stablecoin yield hurdle, with Coinbase reporting a deal reached on stablecoin rewards, opening a path toward markup, per The Block. BTC moved above $78,000 as that news hit on May 2.
A CryptoQuant note flagged that Bitcoin's April price surge was "speculative," warning that spot demand remains weak relative to the move and signaling correction risk. Worth paying attention to given the signal flip frequency this week.
Ethereum is down 0.3% over 7 days at $2,327. ETH hasn't caught a rotation bid, and BTC dominance at 58.4% reflects that. The S&P 500 set a new record alongside BTC's move. Risk-on sentiment is holding across markets, which gives the LONG thesis some cover for now.
What's the Outlook for BTC Next Week?
The active LONG is up 0.7% on a May 1 entry at $78,138. With RSI at 61.9 and sentiment neutral at 47, there's no obvious catalyst pushing BTC sharply in either direction from here.
Watch $78,000 as near-term support. A slip below it combined with RSI rolling under 55 would be a setup where the signal could flip. Above $79,500 with RSI pushing toward 70 is the continuation scenario to watch.
Given how quickly signals have been flipping this week, tracking every call manually is a lot. CryptoEngine's signals deliver a complete trade plan with entry price, stop-loss, and target levels, with each call logged to the public performance history as it closes.
Frequently Asked Questions
What is the CryptoEngine signal for Bitcoin right now? CryptoEngine's current signal is LONG, active since May 1, 2026. The entry price was $78,138. As of May 3, BTC trades at $78,685, putting the signal up 0.7% with no exit triggered yet.
What does Fear & Greed at 47 mean for Bitcoin? A Fear & Greed reading of 47 (Neutral) means market sentiment is neither panicked nor euphoric as of May 3, 2026. Moves that break out of neutral territory often run further than moves from extreme readings, because fewer traders are positioned for them.
What is Bitcoin's RSI reading as of May 3, 2026? BTC RSI(14) reads 61.9 as of May 3, 2026. That's in the upper neutral zone, elevated after an 18% 30-day run but not yet in overbought territory above 70.
Why does BTC dominance matter for traders? BTC dominance at 58.4% means Bitcoin holds 58.4% of total crypto market cap on May 3, 2026. When dominance is high and stable, capital is concentrated in BTC rather than altcoins. A drop in dominance often signals rotation into alts. That's what traders watch for when looking for market rotation setups.
Disclaimer: This article is for educational purposes only and does not constitute financial advice. Past performance does not guarantee future results. Always do your own research before making trading decisions.
Market data via CoinGecko. News sources: CoinDesk, The Block.