How to Use the Fear and Greed Index to Time Bitcoin Trades
The Fear and Greed Index is at 29 (Fear) as of April 30, 2026, recovered from extreme fear readings near 9 in March when BTC was at $66,461. BTC trades near $76,317, with RSI at 43.1 and BTC dominance at 58.1%. The index is a context filter, not a standalone buy signal.
How to Use the Fear and Greed Index to Time Bitcoin Trades
The Fear and Greed Index reads 29 (Fear) as of April 30, 2026. BTC is trading near $76,317, below the late-April rebound highs but still well above the March panic lows. The question for a trader is practical: does this reading change entry timing, position size, or confirmation requirements?
TL;DR
- Use the Fear and Greed Index to adjust position size and confirmation rules.
- As of April 30, 2026, the index reads 29 (Fear), recovered from a reading of 9 in late March when BTC sat at $66,461.
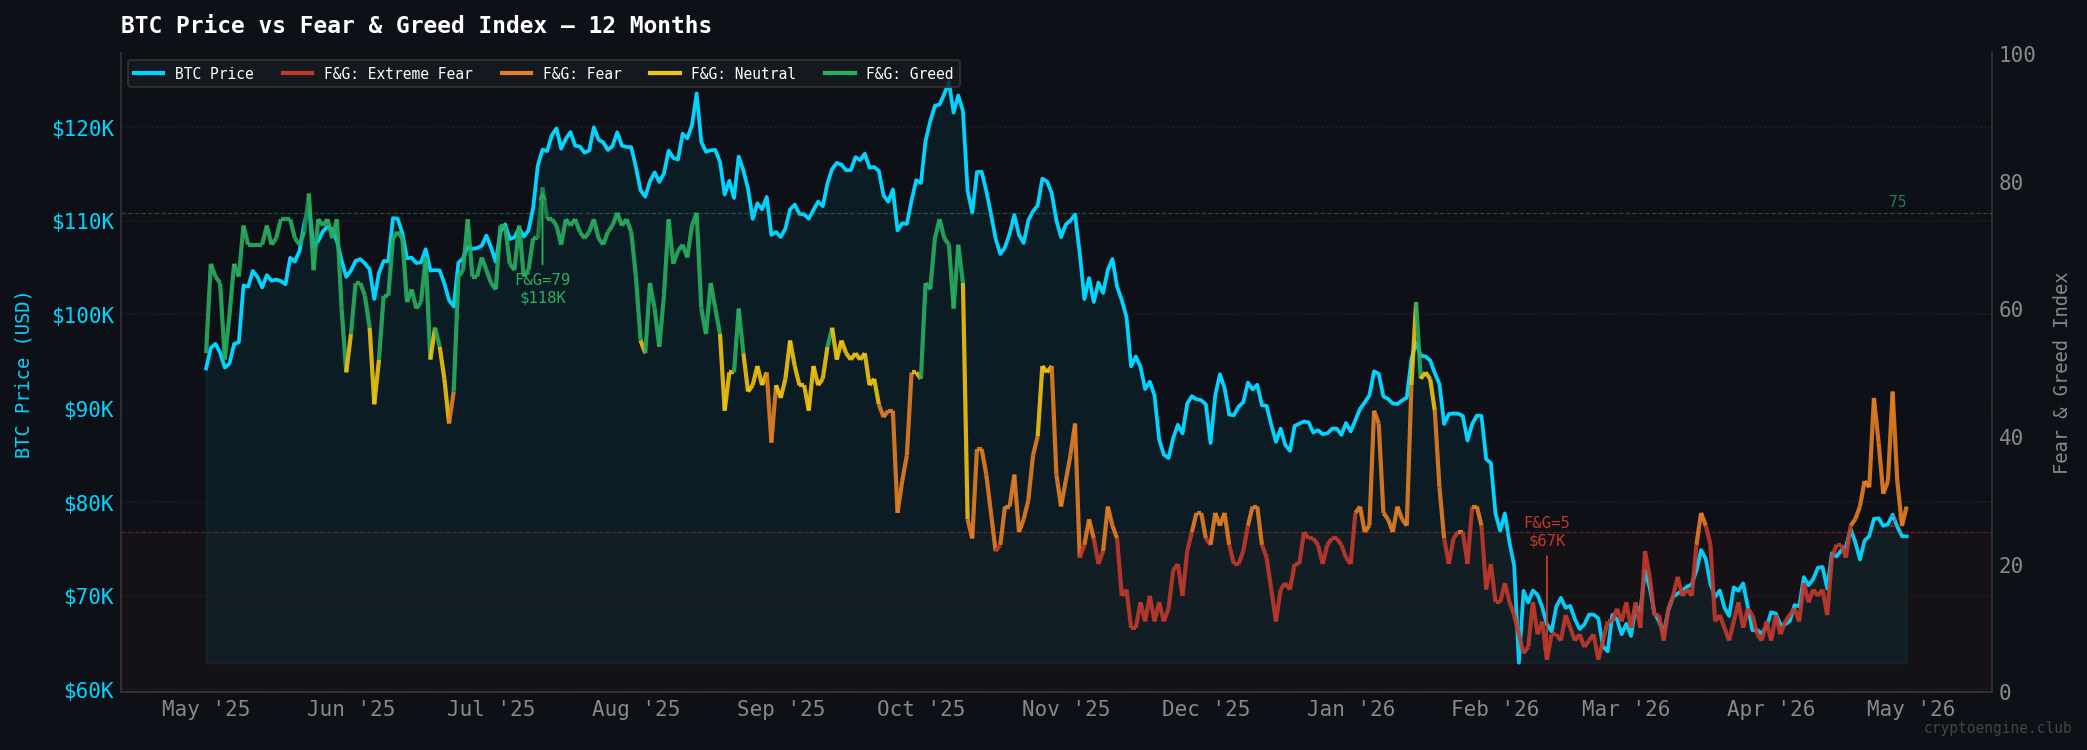
- Extreme fear readings (below 25) have aligned with BTC trading near local lows; extreme greed (above 75) tends to cluster near short-term tops.
- Pair the reading with RSI and price structure before acting.
- CryptoEngine's latest locally cached signal flipped SHORT on April 28 at $76,229. BTC is now near $76,317.
How to read the index before placing a Bitcoin trade
Before placing a BTC trade, use the index to judge the crowd. Panicked markets need different entries than euphoric ones. A fearful reading should usually raise your confirmation bar, not lower it.
I use the zones this way:
| Zone | Score Range | Trading Use |
|---|---|---|
| Extreme Fear | 0-24 | Look for reversal setups, but require price confirmation |
| Fear | 25-46 | Trade smaller or wait for structure to improve |
| Neutral | 47-54 | Let RSI, support, and resistance drive the decision |
| Greed | 55-74 | Stay with trend, but tighten risk controls |
| Extreme Greed | 75-100 | Avoid chasing; watch for exhaustion or stop tightening |
A 9 does not mean buy. A 79 does not mean sell. The number tells you how demanding to be with the rest of the setup.
Where the current reading fits in the trade plan
BTC's recovery from around $66,461 in late March 2026 to $76,317 as of April 30 tracked closely with a sentiment reversal. On March 29, 2026, the index read 9 (Extreme Fear) while BTC sat at those lows. One month later, BTC is up roughly 15% and the index has climbed to 29 (Fear).
The setup has changed. The March trade was about whether capitulation was exhausted. The April 30 trade is about whether the rebound has enough structure to continue. Those are different decisions.
For the historical breakdown behind the chart, see Crypto Fear and Greed Index: What the Data Really Shows. Here, the focus is the next trade decision.
What does a reading of 29 mean for your next trade?
Fear is easier to interpret than neutral, but it still needs confirmation. At 29, the market is cautious rather than panicked. RSI at 43.1 shows weak-to-neutral momentum, so sentiment has repaired faster than price momentum.
Fear plus a sub-50 RSI means caution is still in the tape. You are past maximum panic, but there is no euphoria to fade either. Let the chart do the work:
- Mark the nearest support and resistance.
- Check whether RSI is below 50, crossing 50, or above 60.
- Compare price direction with sentiment direction.
- Size smaller if F&G is in Fear but RSI is weak.
- Add only after price confirms with a close above resistance or a higher low.
This is where entry discipline matters most. If you want a deeper look at how RSI and range structure interact when sentiment is mixed, How to Trade Bitcoin in a Sideways Market covers entry timing for this kind of setup.
When extreme fear becomes actionable
Extreme fear is useful only when price starts to agree. If F&G is below 25 and BTC is still making lower lows, there is no entry yet. If BTC stops making new lows, holds support, or RSI turns up, the setup becomes worth watching.
Use this rule: sentiment marks the opportunity zone; price structure gives permission to act.
The March 2026 setup shows how the layers work together. The index sat near 9 (Extreme Fear) on March 29, while BTC was at $66,461. RSI was well into oversold territory. The trade was not "F&G is low, buy." It was depressed sentiment, oversold momentum, and price holding a support zone.
For traders who want to automate this kind of multi-factor analysis, CryptoEngine's signals apply this exact framework, factoring in sentiment, RSI, dominance, and technical structure before flagging an entry.
How CryptoEngine approaches the index
The Fear and Greed Index is one layer in a multi-input system. It does not set direction. It changes the quality threshold for a trade.
Here is how the combinations usually read:
| F&G + RSI Context | Trade Implication |
|---|---|
| Extreme Fear (below 25) + RSI oversold + price at support | High-conviction LONG setup worth monitoring |
| Extreme Fear alone, no technical confirmation | Too early; no edge yet |
| Extreme Greed (above 75) + RSI overbought | Tight stops on any LONG; watch for reversal |
| Fear (25-46) + RSI below 50 | Wait for structure; avoid oversized longs |
| Neutral (47-54) | Technical structure and RSI drive decisions |
CryptoEngine's latest locally cached signal flipped SHORT on April 28 at $76,229, after the late-April rebound failed to hold momentum. That does not make F&G a sell signal. It means sentiment recovered before price structure did. Buying peak fear in early March without confirmation would have meant sitting through more downside before the recovery took hold.
Process beats the sentiment reading alone.
Common mistakes when turning sentiment into a trade
The most common mistake is treating one F&G reading as a buy or sell trigger. "It's at 9, time to buy" sounds right in hindsight. In real time, it can mean catching a falling knife. Price structure tells you whether the move has reversed.
A second mistake is ignoring duration. A reading of 15 means something different if it appeared yesterday versus three weeks ago. Prolonged fear is more exhausted than fresh fear. If the index has been in extreme fear for 20 days and price has stopped making new lows, that setup carries more weight than a one-day panic reading.
The third mistake is keeping position size unchanged across sentiment regimes. A trade with F&G at 12, RSI turning up, and support holding is different from a trade with F&G at 29 and RSI below 50. Same asset, different setup quality.
How it all fits together
F&G at 29, RSI at 43.1, and BTC dominance at 58.1% point to a market that has stabilized without committing. Sentiment has come off panic without tipping into greed. Momentum is soft, not oversold. Capital is staying in BTC rather than rotating aggressively to altcoins.
The panic of March 2026 has cleared, but buyers have not regained control. The latest locally cached CryptoEngine signal flipped SHORT on April 28 at $76,229, while BTC trades near $76,317. Respect downside risk until structure improves.
If F&G climbs into greed territory, say 60 or 65, risk management on any open LONG gets tighter. Greed means many emotionally motivated buyers have already entered. For now, the lower threshold matters more: a move back above neutral would show that fear is still draining from the market.
Frequently Asked Questions
How should Bitcoin traders use the Fear and Greed Index? Use it to adjust confirmation requirements. Extreme fear can make reversal setups worth watching, but price still has to hold support or reclaim resistance. Greed can support trend-following, but stops should tighten.
What does a Fear and Greed reading of 29 mean for Bitcoin? A reading of 29 is Fear. The market is cautious, but not in maximum panic. It is not low enough to be a deep contrarian extreme and not high enough to confirm broad risk appetite. At 29, RSI and price structure matter more than the sentiment reading.
Is extreme fear a good time to buy Bitcoin? Sometimes, but only after confirmation. Extreme fear is a watchlist condition. It becomes a trade only when BTC stops making new lows, RSI turns up, or price reclaims a level that sellers were defending.
How do Bitcoin traders use the Fear and Greed Index without overreacting? Use extreme readings to spot emotional mismatch, then wait for technical confirmation: a hold at support, a bullish RSI divergence, or a close above resistance. Avoid acting on a single-day extreme reading without structural backing.
Can you use the Fear and Greed Index for altcoins? Use it as a market-wide risk check, not an altcoin entry signal. For individual altcoins, liquidity, token-specific news, and BTC dominance usually matter more than the composite index reading.
Disclaimer: This article is for educational purposes only and does not constitute financial advice. Past performance does not guarantee future results. Always do your own research before making trading decisions.