Bitcoin Support and Resistance: How BTC Traders Use Key Levels
Bitcoin support and resistance are price zones where BTC stops or reverses direction. As of May 17, 2026, BTC trades at $78,011 with RSI at 39.5 and Fear and Greed at 27 (Fear). CryptoEngine's SHORT signal fired after BTC broke below support at $78,156 on May 16.
What Is a Bitcoin Support and Resistance Level: How BTC Traders Use Key Levels
Bitcoin fell 3.6% over the past seven days to $78,011. On May 16, 2026, CryptoEngine's signal flipped SHORT, with the reason given as "Downtrend falling below support." That phrase means something specific.
Bitcoin support and resistance are price zones where BTC repeatedly stalls, bounces, or reverses direction. Knowing where those zones sit, and what happens when price breaks through them, is how most technical traders frame entries, stops, and exits.
TL;DR
- Bitcoin support is a price zone where BTC finds buyers and stops falling. Resistance is where sellers step in and cap rallies.
- As of May 17, 2026, BTC trades at $78,011, down 3.6% over seven days, with RSI(14) at 39.5 and Fear & Greed at 27 (Fear).
- When BTC breaks below support, that zone tends to flip: what was floor becomes ceiling.
- CryptoEngine's active SHORT signal fired on May 16, 2026 at $78,156 after BTC broke below a support zone that had been holding through early May.
- Support and resistance work best when combined with RSI and sentiment data, not used in isolation.
What are support and resistance levels in bitcoin trading?
A bitcoin support level is a price zone where BTC consistently finds buyers, causing price to stop falling or reverse upward. A resistance level is where sellers consistently show up, capping upward moves.
Neither is a precise number. In practice, these are zones, often several hundred dollars wide. BTC might repeatedly stall between $77,800 and $78,300 rather than bouncing off exactly $78,000. Traders who wait for a specific price miss the structure; those watching the zone catch the reaction.
The diagram below shows how these zones work in a ranging market, with support at the bottom, resistance at the top, and a mid-range area where neither buyers nor sellers have a clear edge:
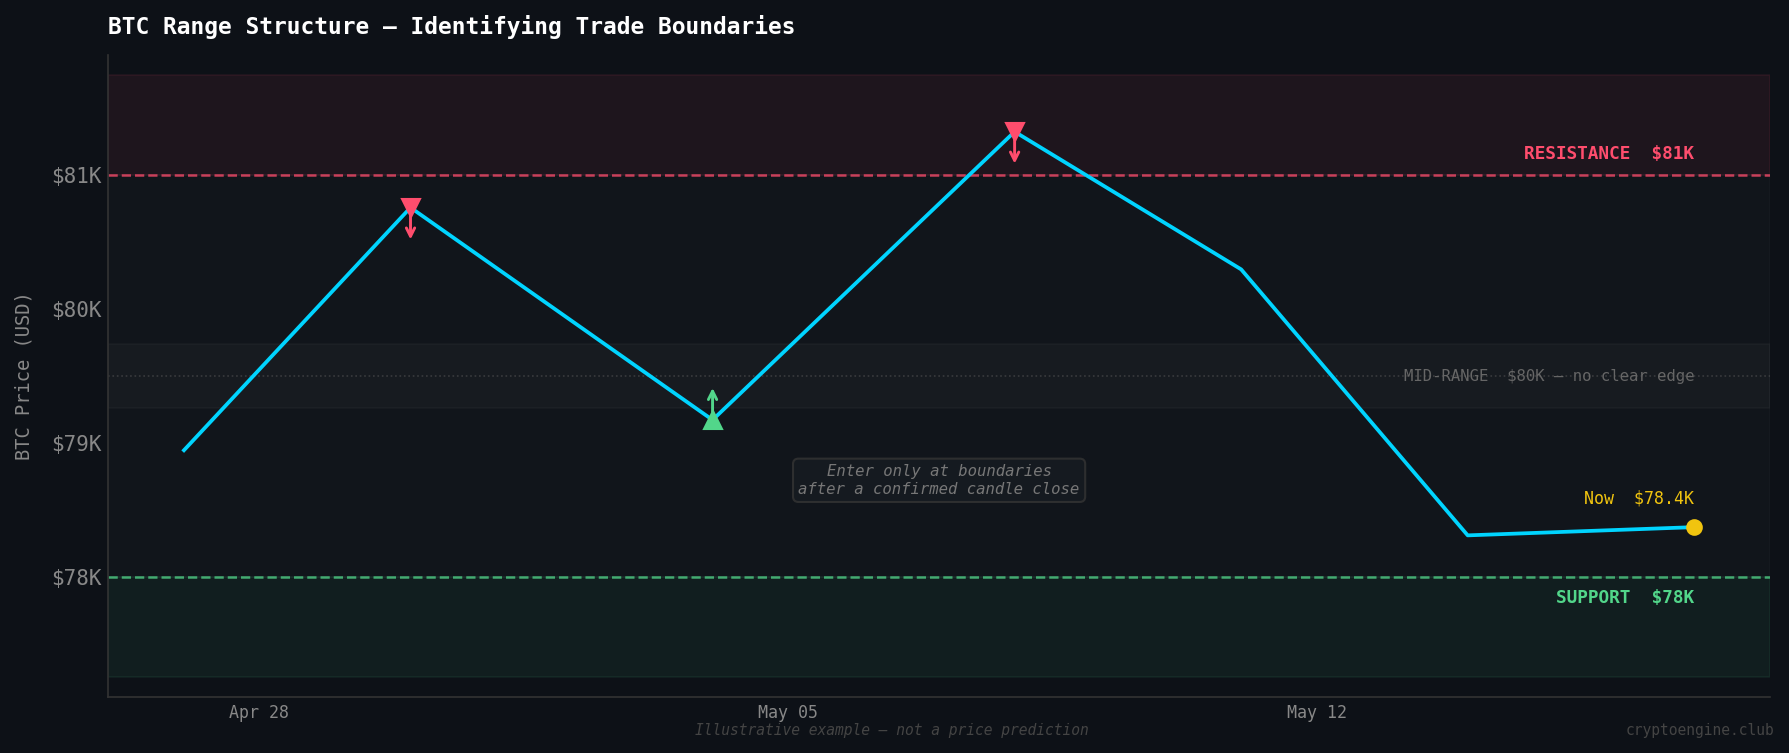
The flip rule is worth knowing early: once support breaks convincingly, that same zone tends to become resistance. Traders who bought there are underwater; when price returns, they sell to break even. That overhead supply is why flipped levels hold.
These zones form from price memory. Every trader who bought BTC at $78,200 in early May has a reference point. If price goes higher, they're in profit. If it drops, they're watching for a return to breakeven. When price revisits that level, those decisions activate at once.
Round numbers like $75,000, $80,000, and $85,000 attract disproportionate attention because order books cluster there. High-volume consolidation zones leave a footprint: if BTC traded heavily in a tight range over multiple days, that range matters the next time price visits it. The more times a level has held, the more traders expect it to hold again. Until it breaks.
How do traders identify support and resistance on a BTC chart?
The direct method is historical price action. Look for zones where BTC repeatedly bounced up or reversed down. Recent highs and lows are natural starting points. Multi-week consolidation ranges are reliable markers.
A simple price ladder for BTC's current structure, based on May 17, 2026 data:
Level Range            What it represents
$82,000 - $84,000      Prior resistance from late April highs
$79,500 - $80,200      Resistance zone (flipped from prior support)
$78,000 - $78,200      Key level: support that broke May 16, now resistance
$75,000 - $76,000      Support zone: March-April base
$71,000 - $72,000      Deeper support from the early 2026 range
These are not predictions. They are zones where past market activity suggests buyers or sellers have been active. How price behaves when it reaches each one is what tells you whether the level holds.
Volume is the filter. A clean break of $78,000 on heavy volume during peak trading hours carries more weight than the same move on thin weekend volume. The level is the starting point; volume confirms or denies it.
What happens when bitcoin breaks through support?
Two outcomes are common. A real breakdown: price moves decisively below support, retests the zone from underneath to confirm the flip, then continues lower. A fakeout: price dips below the level briefly, flushes stops, then recovers. The fakeout version usually shows up as a quick spike with no volume follow-through and a fast reclaim of the level.
In real time, you often cannot tell which one you're seeing. What helps is looking at context:
- RSI at 39.5 on May 17 is neutral, not oversold. No bounce setup is visible on momentum alone.
- The Fear & Greed Index at 27 (Fear) puts crowd sentiment in negative territory. That can precede a capitulation bottom or signal that more selling is still coming.
This is why CryptoEngine uses multiple inputs rather than levels alone. A support break with declining RSI and fearful sentiment reads differently than the same break with RSI already at 25 and Fear & Greed at 8 (Extreme Fear). Context changes the probability of follow-through.
How CryptoEngine reads support and resistance breaks
CryptoEngine's active signal as of May 17, 2026 is SHORT, with entry at $78,156 on May 16 and BTC currently at $78,011, down 0.2% from entry. The stated reason is "Downtrend falling below support."
The signal is not saying BTC will definitely fall from here. It is saying the structural context has shifted: the floor that held through early May gave way, and the trade setup now favors the short side until something changes.
CryptoEngine combines support and resistance with RSI, Fear & Greed, and BTC dominance before generating a call. The May 16 SHORT had a support break with no offsetting oversold or reversal signal, tipping the setup toward short with nothing to push back against it.
See how CryptoEngine tracks signal entries, stops, and targets in real time.
Common mistakes with support and resistance
The most common error is treating levels as exact prices. Someone places a buy at exactly $78,000, price wicks to $77,600 before recovering, and they're stopped out. The bounce happens. They just aren't in it. Thinking in zones instead of lines fixes this.
Volume gets ignored too often. A break below support on thin Sunday evening volume has a very different meaning than the same break during peak New York or London hours. Volume confirms or undermines what the price action appears to show.
Many traders forget the flip rule after a break. Once support gives way, that level is resistance until proven otherwise. Buying back into a broken support zone means buying into overhead supply, which tends to cap recoveries.
The subtler mistake is using support and resistance without reading the environment. A support break at Fear & Greed 80 with RSI at 72 reads completely differently than the same break at Fear & Greed 27 with RSI at 39. Same price, very different context.
How it all fits together
Look at where all the inputs sit on May 17, 2026. BTC at $78,011 has broken below the $78,000 to $78,200 zone that held through early May. RSI at 39.5 shows no oversold bounce setup. Fear & Greed at 27 puts the crowd in fear without yet reaching the extreme readings where sharp recoveries tend to start.
The active SHORT signal captures all of this: a structural break, no offsetting oversold signal, and sentiment that hasn't hit a capitulation floor. That's what a complete read looks like.
No combination of indicators removes uncertainty. What they do is show you where buyers and sellers are positioned, so you're working with the structure rather than guessing against it.
Frequently Asked Questions
What is bitcoin support and resistance? Bitcoin support is a price zone where BTC consistently finds buyers, causing price to stop falling or reverse upward. Resistance is where sellers show up to cap rallies. These zones form because traders remember where they bought or sold and act on those prices when the market returns to them.
How do you identify support and resistance levels on a BTC chart? Look for price zones where BTC has bounced or reversed multiple times, especially near round numbers like $75,000 or $80,000. Recent highs and lows, multi-week consolidation ranges, and high-volume trading bands are the most reliable markers. Zones matter more than exact prices.
What does it mean when bitcoin breaks below support? When BTC breaks a support level, that zone often becomes resistance: traders who bought at support use the return to break even to sell, creating overhead supply that caps recoveries. Whether the break holds depends on volume, momentum (RSI), and crowd sentiment (Fear & Greed).
How does support and resistance connect to CryptoEngine signals? CryptoEngine signals use support and resistance as one input alongside RSI, Fear & Greed, and BTC dominance. The May 16, 2026 SHORT signal fired after BTC broke below a support zone at $78,156, with the reason given as "Downtrend falling below support." The signal captures the structural shift as part of a broader context read.
Is support and resistance reliable for trading BTC? No technical tool is reliable in isolation. Support and resistance work best as a framework for placing stops and targets, not as standalone prediction tools. Combined with momentum indicators and sentiment data, they give you a clearer read of where active buyers and sellers are positioned.
Disclaimer: This article is for educational purposes only and does not constitute financial advice. Past performance does not guarantee future results. Always do your own research before making trading decisions.
Market data via CoinGecko. News sources: CoinDesk, The Block.