Bitcoin Support Breakdown: $73,370 to $63,052 — What to Do Now
BTC broke below support on May 28 at $73,370 and sits at $63,052 as of June 5, down 14%. A second SHORT confirmed the downtrend June 2 at $66,316. RSI 22.5, Fear and Greed at 11. Real support breaks require multiple closes, not a wick. Old support becomes resistance.
Bitcoin Support Breakdown: What to Do When BTC Breaks a Key Level
On May 28, 2026, CryptoEngine's SHORT signal fired at $73,370. The system's reason: "Downtrend falling below support." By June 5, BTC had dropped to $63,052, down 14% from that entry point. A second SHORT signal confirmed the downtrend on June 2 at $66,316, as the system tracked the continued structural breakdown.
A bitcoin support breakdown is one of the most misread events in BTC trading. Some traders treat every brief dip below a line on the chart as an emergency. Others ignore clear structural damage until they are well underwater. Getting this right, or at least less wrong, starts with knowing the difference between a genuine breakdown and a fake-out. The response follows from that.
TL;DR
- BTC broke below a key support level on May 28 at $73,370 and is now at $63,052 as of June 5, 2026, down 14% from the break point.
- A confirmed support break means multiple candle closes below the level, not a single wick below it.
- After a break, old support becomes new resistance. The $73,370 zone is now the ceiling to watch on any bounce.
- RSI at 22.5 and Fear and Greed at 11 (Extreme Fear) as of June 3 show the move is stretched, but stretched does not mean finished.
- CryptoEngine fired a second SHORT on June 2 at $66,316 as the downtrend continued. The system tracks structural damage at each new break point, not just the first.
What is a Bitcoin support level, and why does it break?
A Bitcoin support level is a price zone where buyers have consistently absorbed selling pressure and prevented further decline. On a chart, it is a floor: price approaches it, buyers step in, and price bounces.
Support doesn't hold forever. Every level eventually breaks if selling pressure is sustained enough. The mistake most traders make isn't misidentifying the support. It's treating it as permanent. Every "unbreakable" support level in crypto history has at some point broken. The question is never whether it can break, but whether the current price action is a real break or a temporary probe.
For more on how to draw support and resistance levels, see Bitcoin support and resistance levels explained.
How do you tell a real support break from a fake-out?
The most common mistake is reacting to wicks. Price briefly dips below a level, hits trader stop-losses, then snaps back above. This is a stop hunt. Getting knocked out of a good position by a stop hunt is a cost of trading, not a sign the setup was wrong.
A real break looks different. The candle closes below the level, not just wicks. The next candle opens below it. Volume often picks up on the break. RSI confirms the directional shift rather than showing an extreme oversold reading consistent with a quick snap-back.
A quick reference for distinguishing the two:
| Price behavior | RSI | Volume | Interpretation |
|---|---|---|---|
| Wick below support, closes above | Oversold or neutral | Normal | Likely stop hunt, watch for recovery |
| One close below, opens above next day | Oversold | Low | Borderline; wait for more candles |
| Multiple closes below support | Neutral to falling | Increasing | Confirmed breakdown |
| Close below support, RSI continuing lower | Not oversold | High | Strong breakdown, old support = new resistance |
| Close below support, RSI at extreme low | 15-25 range | Declining | Stretched breakdown; bounce possible, trend still down |
The May 28 break fits the fourth row. CryptoEngine saw a downtrend with price closing below support, RSI confirming the directional move. By June 3, RSI was at 22.5, placing the market in the last row: stretched to the downside, but the original breakdown structure still intact.
What are the right steps after a support break is confirmed?
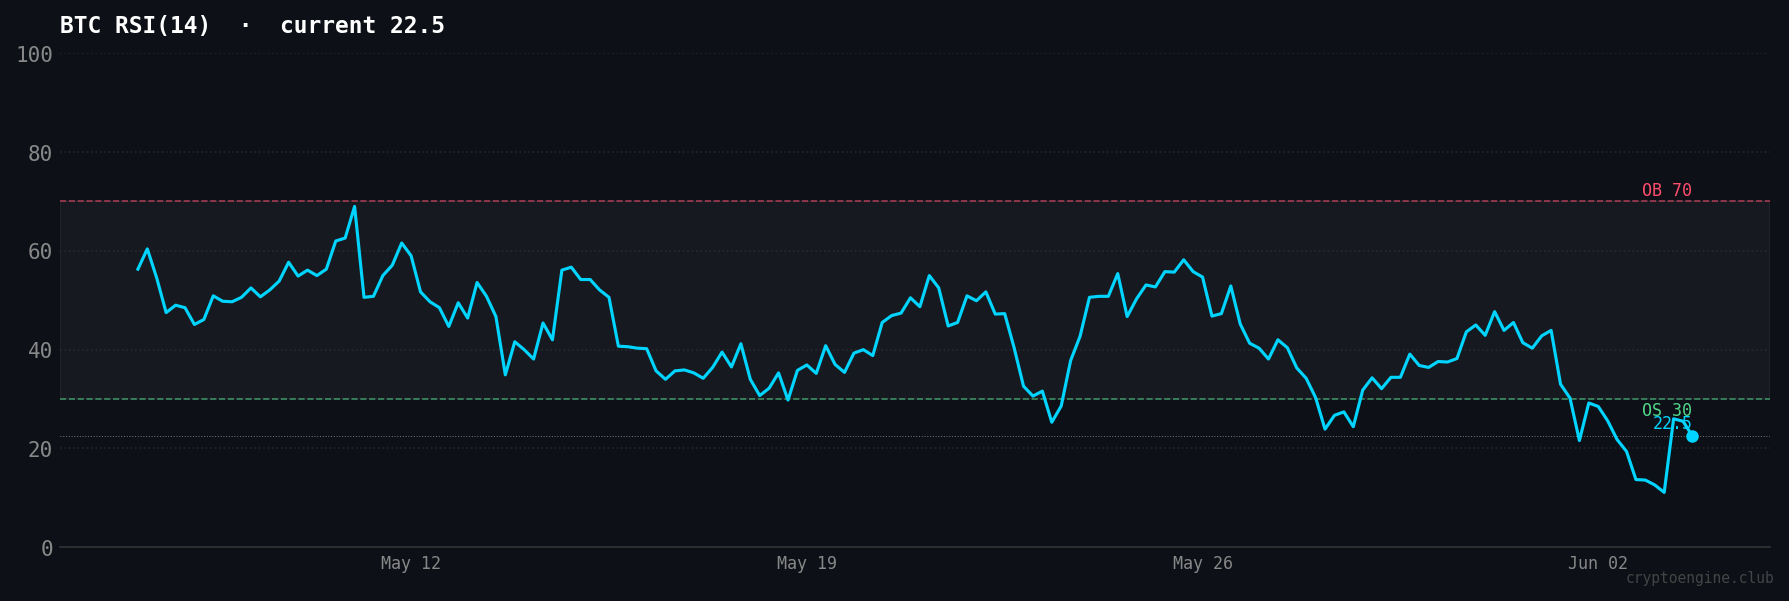
The RSI chart below shows the 30-day momentum picture as of June 3. RSI at 22.5 sits in oversold territory, but notice it has been declining steadily since the May 28 break — not showing the sharp V-reversal shape that typically precedes a quick snap-back. The oversold reading tells you the move is mature, not that it is ending.
After a support break is confirmed, the structure of the trade changes. What you do depends on where you are.
If you are already in a long, the support that justified the trade no longer exists. The cleanest response is to exit on confirmation. If you want to stay in, tighten your stop to just above the broken level, which is now resistance. At minimum, reduce position size to reflect the changed risk. Holding a full position through a confirmed break because you expect a bounce is not risk management.
If you are not in a trade yet, the breakdown gives you a directional lean without an immediate entry. Shorting the first candle after a break often means chasing a stretched move. The cleaner setup is to wait for a retest of the broken level from below. If old support holds as new resistance, that is a defined entry with a clear stop just above.
Here is what the zone structure looks like after the May 28 break:

The retest of $73,370 is the most important near-term level to watch. If BTC rallies back to that zone and sellers step in again, the downtrend has a clear structural reason to continue. If price reclaims $73,370 and holds above it, the breakdown is failing and the short case weakens.
How CryptoEngine handled the May 28 support break
The emotional pull to wait for a bottom is strong. A systematic process overrides it. On May 28, CryptoEngine identified the downtrend breaking below support and issued a SHORT at $73,370. By June 5, BTC was at $63,052, a 14% move from that entry. When BTC broke another level on June 2, the system issued a second SHORT at $66,316. It wasn't assuming the May 28 signal covered everything; it tracked each structural break as it happened.
The signals fire at each break point, not at the bottom. That is the design: act when the structural damage is confirmed, not after the full move has played out. Waiting for a bottom that "feels safe" usually means entering after the best risk/reward has already passed.
RSI at 22.5 and Fear and Greed at 11 (Extreme Fear) as of June 3 are both stretched readings. They don't mean the SHORT is finished — extreme readings can persist in strong trends. But they do mean the trade is mature, and adding size at these levels carries worse risk/reward than the original entries did.
The signal history at cryptoengine.club shows the entry reason and price for each call if you want to see how the system has handled support breaks over time.
Common mistakes traders make after a bitcoin support breakdown
Treating every wick as a break is the most common one. Price briefly dips below a level, traders exit or flip short on a single candle. If price recovers above the level, the setup was a stop hunt and the reaction was premature. Always wait for a close.
Chasing the initial breakdown is a close second. Shorting BTC at $60,000 when the support break already happened at $73,370 means entering well into a stretched move with unfavorable risk/reward. The setup was at the break point, not after it.
RSI in the low 20s is oversold, but that doesn't mean price bounces now. RSI tells you the trend is extended, not that it reverses today. Buying oversold conditions against a confirmed broken structure means fighting both the direction and the momentum at once.
Holding a long because "this level held before" is the same trap in different clothes. History is context, not a guarantee. If BTC held $73,370 three times and then broke, those previous holds don't make the current break less real. The structure failed.
Missing the resistance retest is also common. Traders who exit correctly at the break often miss the second setup: the bounce back to the old support (now resistance). That retest usually offers a cleaner entry with a defined stop above the level.
Before acting on any bitcoin support breakdown, run through these questions:
- Has price closed below the level, or was it only a wick?
- Has the break been confirmed by more than one candle?
- Is RSI confirming the directional move or showing an extreme that suggests a quick snap-back?
- Where is the next meaningful support zone below the break?
- Where is the broken level now as resistance, and is that the likely retest target?
- If already in a long: does the structure that justified this trade still exist?
How it all fits together
Support levels, RSI, and the Fear and Greed Index measure different things, but they tell a consistent story when they agree. On May 28, a falling structure (support break confirmed) coincided with RSI in a declining trend, not an extreme. The signal fired. By June 3, RSI was at 22.5 and the Fear and Greed Index had dropped to 11 (Extreme Fear). Those extremes don't undo the support break, but they do inform how to manage risk on a SHORT trade that is deep in profit. When a second support level broke on June 2, the same pattern repeated: structure failed, system confirmed, second signal issued.
A support break with neutral RSI is different from one where RSI is already falling from overbought. A breakdown into extreme fear is different from one where sentiment is neutral. The support break is what triggers the entry. The other readings shape how you manage the trade once you're in.
Frequently Asked Questions
What does it mean when Bitcoin breaks a key support level? A Bitcoin support break means price has closed below a zone where buyers previously stopped declines. It shifts the structure from a potential reversal area to a confirmed downtrend, at least on that time frame. The broken support level often becomes new resistance after the break.
Is a Bitcoin support break always bearish? No. Fake-outs happen when price briefly closes below support and quickly reclaims it. A break is more reliably bearish when it comes with multiple closes below the level, RSI trending lower rather than showing an extreme oversold reading, and increased volume. A single wick without a close rarely confirms a real breakdown.
How do you find the next support level after a break? Look for previous areas where BTC reversed sharply or spent time consolidating. These are zones where buyers stepped in before. After a break, the next support is usually a prior swing low, a round price cluster, or a zone with concentrated historical trading activity. After the May 28 break, the $65,000 zone was the first reference area — BTC reached and broke through it in early June. The next reference area is near $60,000.
Should you short Bitcoin immediately when support breaks? Not necessarily. The initial breakdown often extends quickly, so the risk/reward on an immediate entry is poor. Better to wait for price to retest the broken level from below. If old support holds as resistance on the bounce, that's a short entry with a clear stop just above the level.
How does CryptoEngine signal a support break? CryptoEngine monitors price structure and momentum together. The May 28 SHORT fired with the reason "Downtrend falling below support" at $73,370. The signal fires when both the structural break and the directional momentum are confirmed simultaneously, rather than on the first wick below a level.
Disclaimer: This article is for educational purposes only and does not constitute financial advice. Past performance does not guarantee future results. Always do your own research before making trading decisions.
Market data via CoinGecko.