How to Know When to Buy Bitcoin: RSI, Fear and Greed
Bitcoin trades at $65,195 with Fear & Greed at 31 and RSI at 58.1 as of August 9, 2026. Traders who time entries well use RSI zones, sentiment extremes, and structural triggers together, not any single indicator alone.
How to Know When to Buy Bitcoin: RSI, Fear & Greed, and Signal Timing
Figuring out when to buy bitcoin is one of the most common questions active traders wrestle with. Every dip looks risky when you're inside it. Every rally feels like it might have more runway. This piece covers three indicators that help with entry timing: RSI, the Fear & Greed Index, and structural signal triggers. Each works better alongside the others than alone.
TL;DR
- Bitcoin trades at $65,195 as of August 9, 2026, with Fear & Greed at 31 (Fear) and RSI(14) at 58.1.
- RSI and sentiment are pulling in different directions right now: RSI has climbed into neutral-to-strengthening territory while Fear & Greed is still stuck in Fear. That split matters more than either number alone.
- Fear & Greed below 30 has historically clustered around local price lows in BTC's 12-month correlation data, making it a better zone to start building a position than readings above 70.
- The most reliable entries combine RSI stabilization, a sentiment extreme, and a price structure trigger. No single indicator alone is reliable.
- CryptoEngine's current LONG signal (active since August 5 at $64,580) fired on a breakout above resistance, not on an oversold RSI reading alone.
Why most traders get entry timing wrong
Timing any asset is hard. BTC is harder because sentiment moves fast and the noise is constant. You'll see "buy the dip" posts every time bitcoin drops 5% and "bull run confirmed" every time it recovers 3%. Both calls are usually early, late, or just wrong.
The traders who do this consistently well aren't smarter. They're more systematic. They decide in advance what conditions need to be true, then wait for them to line up. That's the entire job.
Three indicators give you the most useful signal per unit of noise for BTC entry timing. Here's what each one actually tells you.
What does RSI tell you about bitcoin entry timing?
RSI (Relative Strength Index) is one of the most searched tools for figuring out when to buy bitcoin. It measures how much BTC has moved up or down over the past 14 periods relative to its recent range, outputting a number between 0 and 100.
The common shorthand: below 30 = oversold = buy. That's an oversimplification. An oversold RSI tells you recent momentum has been heavily negative. It doesn't mean price is about to reverse.
What the zones actually mean for entries:
| RSI Range | Label | What it means for entries |
|---|---|---|
| 0-30 | Oversold | Momentum is severely negative. Entries can work at bottoms but often require multiple tests before price turns. Don't treat the first cross below 30 as a trigger. |
| 30-40 | Weakening | Selling is easing. Better for staged entries than all-in positions. Wait for RSI to flatten before adding size. |
| 40-50 | Neutral/lower | Momentum is ambiguous. Waiting for RSI to hold above 40 and stabilize is more conservative, but usually cleaner. |
| 50-60 | Neutral/higher | Moderate upward momentum. Continuation setups work better here than contrarian plays. |
| 60-80 | Strengthening | Uptrend in motion. Dip buying within the trend is the standard approach. |
| 80-100 | Overbought | Momentum running hot. Entering here means buying near short-term tops. |
As of August 9, 2026, BTC's RSI is 58.1, neutral to slightly strong. Not an overbought warning, but not a discount either. What's worth watching is whether RSI keeps climbing toward the 60-80 strengthening band or stalls out here as price digests the recent move.
The 12-month RSI history makes this concrete:
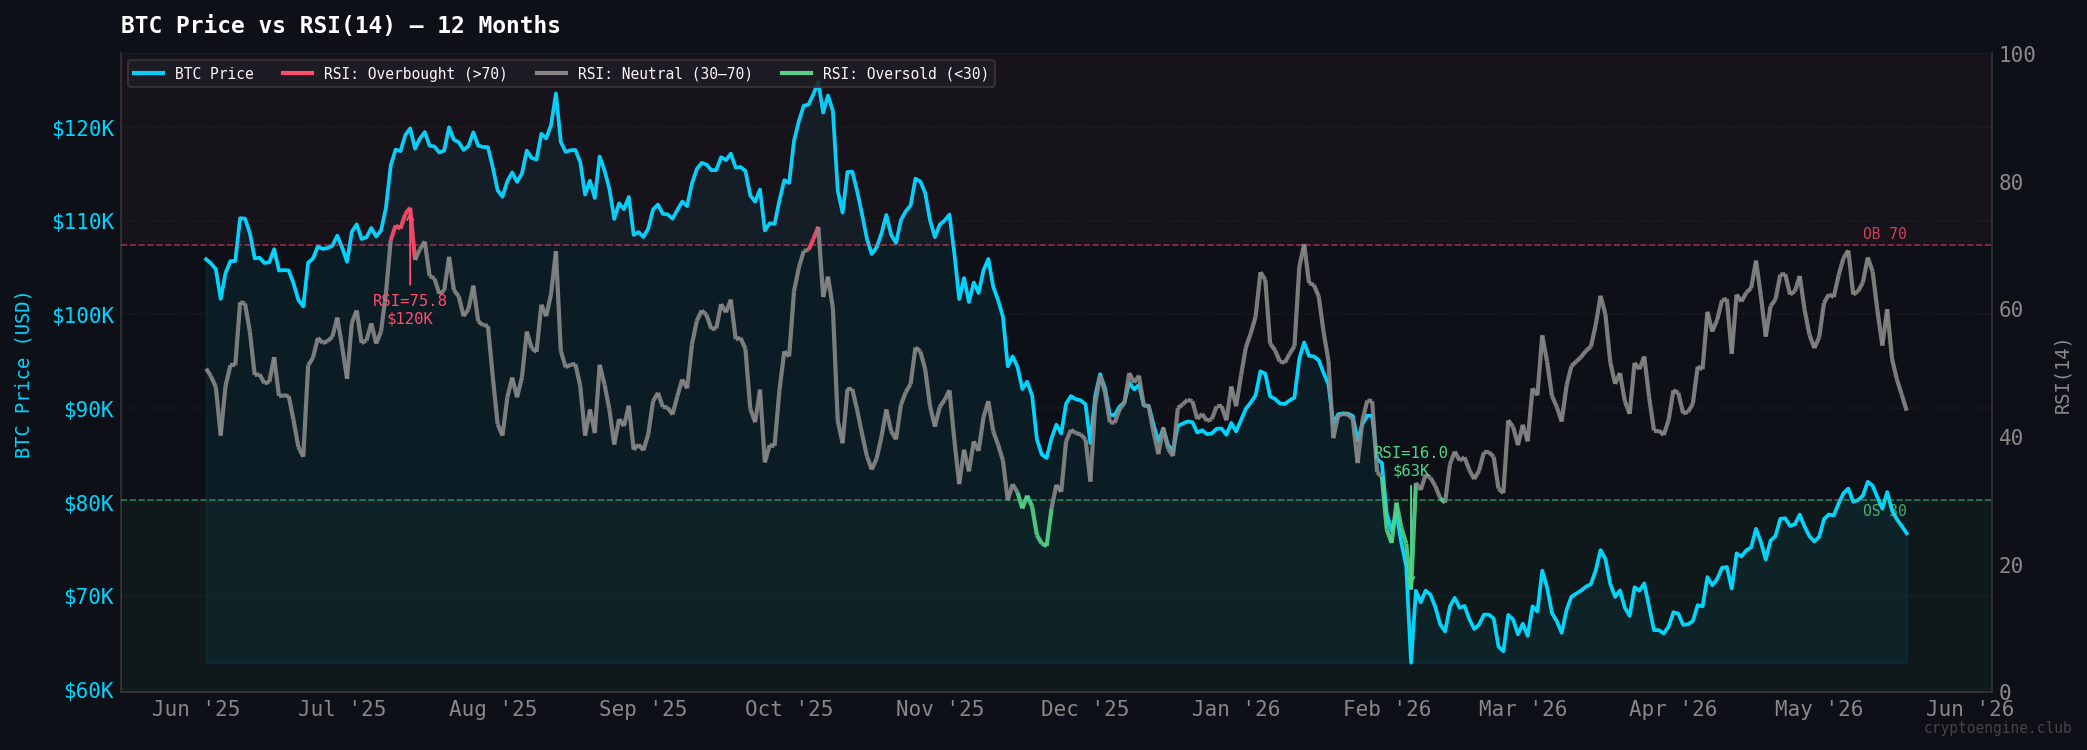
The green-shaded oversold zones in this chart didn't all produce quick recoveries. Some dragged for weeks. The entries that worked share one feature: RSI stopped making new lows while price also stopped falling. The signal isn't the first cross below 30 — it's when the selling exhausts itself.
What does the Fear & Greed Index tell you about when to buy?
The Fear & Greed Index is a composite sentiment reading from 0 (Extreme Fear) to 100 (Extreme Greed). As of August 9, 2026, it reads 31, still in Fear territory even after BTC's climb back above $65,000.
The contrarian idea is straightforward. When most market participants are scared, they're already underweight or out of BTC. That creates a setup where a positive catalyst moves price fast because there aren't many sellers left. When everyone's greedy and leveraged long, the opposite setup exists.
The catch: Fear can get worse before it gets better. A reading of 27 can become 15.
Here's the 12-month correlation between Fear & Greed and BTC price:
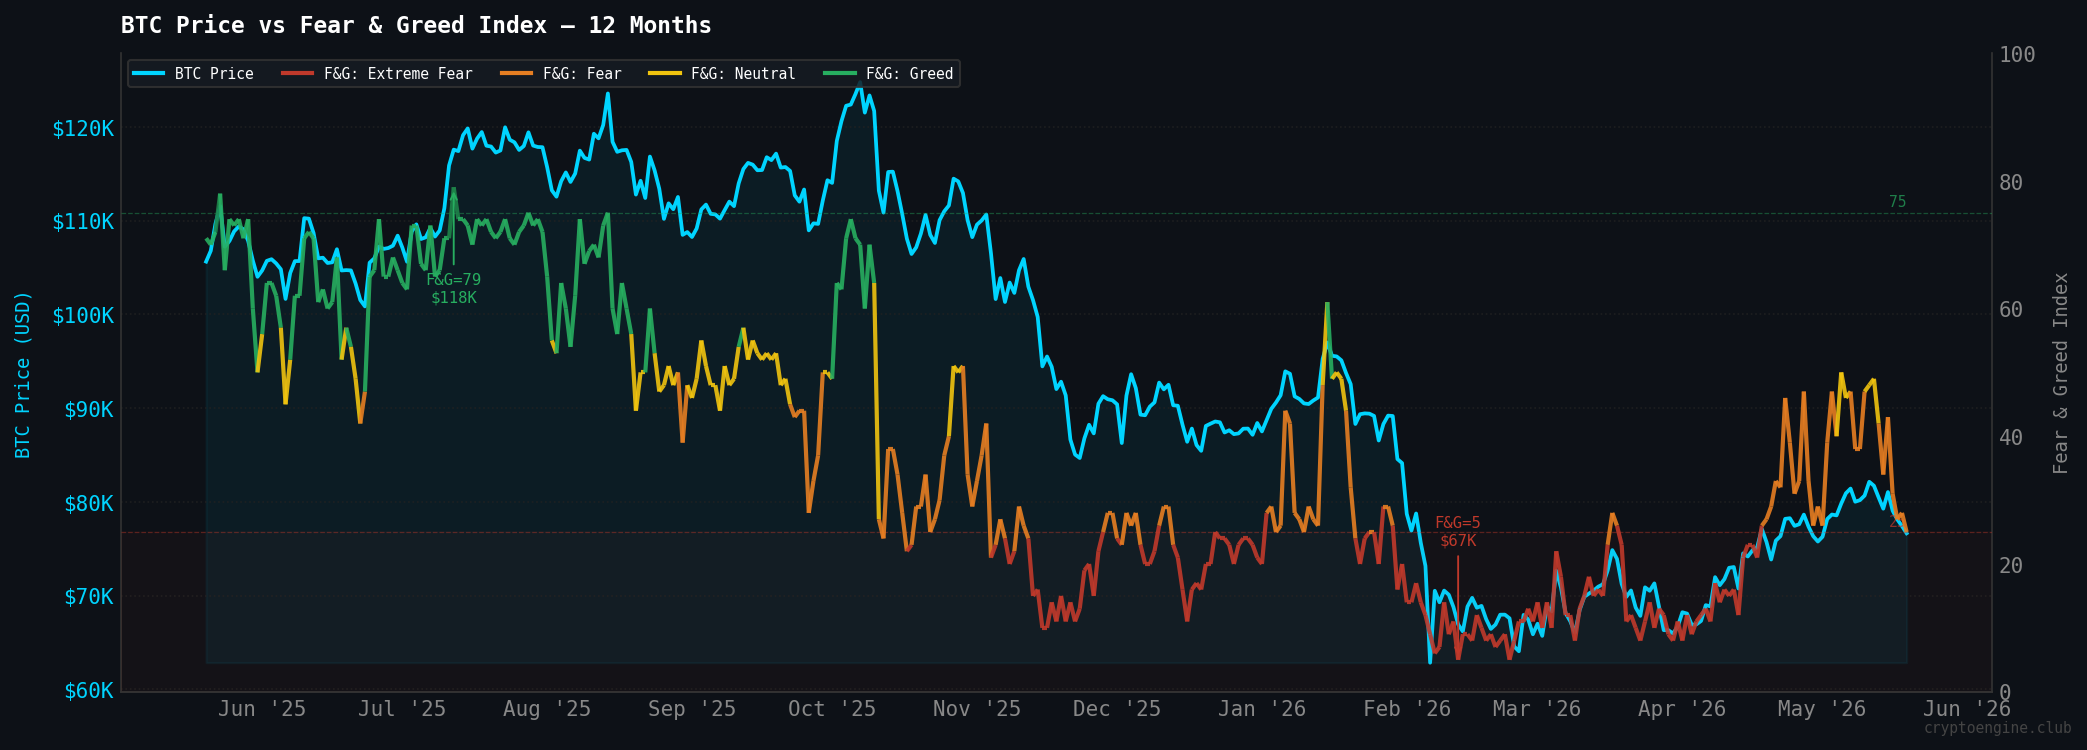
The pattern in this chart is that sharp sentiment drops cluster near local price lows, not at precise bottoms but nearby. Entries made in Fear periods have tended to perform better over multi-week horizons than entries made in Greed periods, based on the 12-month data. "Better on average" isn't the same as "always works," though.
The practical rule: Fear & Greed below 30 is a better zone to start building a position than above 70. Right now at 31, you're just outside that threshold, but still nowhere near the greed readings that mark local tops. It doesn't mean buy everything today. The risk/reward of an initial position is simply more favorable here than at 60 or 70.
How do RSI and Fear & Greed combine as a buy signal?
Neither works reliably alone. RSI tells you about price momentum. Fear & Greed tells you about trader psychology. When both lean the same direction, the signal is more useful than either one by itself.
A rough guide to combining the two:
| RSI zone | Fear & Greed | Trade bias |
|---|---|---|
| Below 35 | Below 25 (Extreme Fear) | Strongest contrarian buy conditions, but expect high volatility |
| 35-45 | 25-35 (Fear) | Moderate buy bias; watch for RSI to stop falling before entering |
| 45-55 | 35-55 (Neutral) | No directional edge, wait for structure |
| 55-65 | 55-70 (Greed) | Mild continuation bias, small additions only |
| Above 65 | Above 70 (Greed) | Avoid new buys, potential reversal zone |
Right now the two indicators don't line up cleanly. RSI at 58.1 sits in the 55-65 band, which usually pairs with Greed-zone sentiment above 55. Instead, Fear & Greed is still at 31, deep in Fear. That's a real divergence: price and momentum have recovered faster than trader sentiment has. Divergences like this don't have a clean "buy" or "wait" answer from the table alone — they're a signal to lean on the structure check below rather than the indicators.
How CryptoEngine approaches entry timing
CryptoEngine's signals don't fire on RSI or sentiment alone. The current active LONG triggered on August 5 at an entry price of $64,580 for a reason described as "downtrend breaking above resistance": a structural trigger. It's up about 1.0% as BTC trades near $65,195.
That framing is the key distinction. The signal waited for price to show actual breakout behavior before entering. RSI and Fear & Greed gave the backdrop, but price crossing above resistance was the actual trigger. Indicators said "conditions are possible." Price structure said "act now."
This is how systematic approaches differ from indicator-chasing. You use RSI and sentiment to identify favorable windows. You use price structure to find the specific entry point within that window.
The results reflect that discipline: CryptoEngine's last 10 completed signals show a 10/10 win rate at the 5-day mark. The most recent completed signal before the current one was a LONG that fired July 30 and returned +0.1% at 5 days: a thin margin, but still correct. That kind of consistency comes from having entry criteria, not from watching RSI alone. See how CryptoEngine's signal approach works.
Common mistakes traders make when timing bitcoin buys
Treating one oversold RSI reading as a buy trigger. RSI can stay below 30 for days or weeks during sustained downtrends. The reading tells you momentum is negative, not that a reversal is imminent. A threshold crossing is a condition, not a trigger.
Buying into falling sentiment without watching for stabilization. Fear & Greed at 31 is a better entry zone than 70, but if the driver of that fear is ongoing, selling pressure may not be finished. Earlier this month, the Coldcard hardware wallet exploit spread to 4,500 addresses with losses near $89 million: an event-driven panic that showed how sentiment can lag a specific, ongoing risk well past what indicators alone would predict.
Using round-number price targets instead of market structure. "I'll buy at $60,000" is self-imposed. Support levels derived from price history (previous highs that became support, congestion zones, moving average clusters) are levels the market has already revealed as significant. Round numbers often don't align with those.
Adding to a losing position without a pre-defined plan. Averaging down can be smart or costly, depending on whether you planned it. "I'll add 25% more if price drops to $60,000 and RSI hits 32" is a plan. "I'll keep buying because it'll recover" is not. See how to set a stop-loss for bitcoin trading for a framework on defining your risk before entering.
Practical checklist: before you buy BTC
Run through these before entering:
- RSI check: Is RSI above 40 and stabilizing, or still falling? A falling RSI below 40 means wait for it to flatten.
- Sentiment check: Is Fear & Greed below 30? Below 30 is historically the better entry zone. Above 60? Reduce position size.
- Structure check: Has price shown a catalyst such as a held support test, a failed breakdown, or a breakout above resistance? If price is in free fall, RSI and sentiment don't change that.
- Size check: Is the position sized so that a 10-15% further drop is manageable? If losing that amount would cause you to panic-sell, the position is too large.
- Exit plan: Do you have a defined stop-loss level and a take-profit target before you enter? If not, set them first.
Frequently Asked Questions
When is the best time to buy bitcoin? There's no single best time, but the pattern across BTC's history shows that RSI below 35 combined with Fear & Greed below 25 marks better average entry conditions than when both are elevated. As of August 9, 2026, RSI is 58.1 and Fear & Greed is 31: momentum has already turned neutral-to-strong while sentiment lags behind in Fear, a divergence worth watching rather than a clean entry signal either way.
Should I buy bitcoin when the Fear & Greed Index is low? Low Fear & Greed readings (below 30) have historically been better average entry zones than readings above 70. But sentiment alone doesn't tell you when to pull the trigger. Use Fear & Greed to gauge how favorable the environment is, and use price structure to pick the actual entry point.
What RSI level signals a good bitcoin buy? RSI stabilizing above its most recent low while price holds a support level is more useful than any specific threshold. A reading of 32 with price still falling is not a clean entry. A reading of 38 that's flatlined while price holds a key level often is. The direction and stabilization matter more than the exact number.
How do signal services factor into buy timing? Systematic services like CryptoEngine combine RSI, sentiment, and price structure to define entries with specific parameters: entry price, stop-loss, and take-profit. The current LONG entered at $64,580 on August 5 on a structural breakout. It didn't fire on RSI or sentiment alone. That's the difference between reading indicators and having a complete entry framework. For more on what makes a signal useful, see what to look for in a bitcoin trading signal.
What if I'm consistently wrong on entry timing? Most traders are. The solution isn't better prediction: it's better position sizing and defined stops. An entry taken at RSI 48 with a clear stop below support is better risk management than waiting for "perfect" conditions and entering without a plan. Consistency in process beats consistency in being right about timing.
Bottom line
Stop asking "when will bitcoin go up?" Nobody knows. The useful question is what conditions make a buy decision reasonable right now. With Fear & Greed at 31 and RSI at 58.1 as of August 9, 2026, the two indicators disagree: momentum has already recovered while sentiment hasn't caught up. Whether sentiment follows price higher or price rolls back to meet sentiment depends on factors no indicator fully captures.
What indicators do is tell you when conditions are better than average. Build a checklist. Use it consistently. Trust the process more than the gut call.
Disclaimer: This article is for educational purposes only and does not constitute financial advice. Past performance does not guarantee future results. Always do your own research before making trading decisions.