Bitcoin at $75,777, Fear at 27: April 19 Recap | Crypto Engine Research
Bitcoin gained 6.9% this week to $75,777. Fear & Greed reads 27 and RSI sits at 52.4. CryptoEngine's April 15 LONG entered at $74,994 and is up 1.0%.
Bitcoin at $75,777, Fear at 27: April 19 Recap
Bitcoin finished the week at $75,777, up 6.9% over seven days. The Fear & Greed Index still reads 27, though. For the BTC signals week of April 19 2026, that gap is the point.
TL;DR
- Bitcoin is up 6.9% this week, trading at $75,777 as of April 19, 2026.
- The Fear & Greed Index reads 27 (Fear). Sentiment is still cautious even with the weekly gain.
- BTC RSI(14) sits at 52.4 (Neutral). Momentum is present but not stretched.
- Bitcoin dominance holds at 57.6%, confirming this is a BTC-led move.
- CryptoEngine's April 15 LONG entered at $74,994 and is up 1.0%, with no exit triggered yet.
Key numbers this week
| Metric | Value | Change |
|---|---|---|
| BTC Price | $75,777 | 🟢 +6.9% (7d), 🔴 -0.6% (24h) |
| ETH Price | $2,327.41 | 🟢 +6.4% (7d), 🔴 -1.6% (24h) |
| Fear & Greed Index | 27 (Fear) | — |
| BTC Dominance | 57.6% | — |
| BTC RSI(14) | 52.4 (Neutral) | — |
| Total Market Cap | $2.64T | 🔴 -0.5% (24h) |
| CryptoEngine Signal | LONG | — |
What did BTC do this week?
Bitcoin pushed from the low $70k range to $75,777 over seven days. The 6.9% weekly gain is real. Nearly $5,000 in price appreciation from the week's open.
The 24-hour read is softer: down 0.6%. After a multi-day run, that is noise unless it starts dragging BTC back under support.
Ethereum followed with a 6.4% weekly gain to $2,327.41. BTC dominance at 57.6% says this is still a Bitcoin-led move. Altcoins are participating, but they are not leading. Total market cap sits at $2.64T, off 0.5% on the day.
What does a Fear & Greed reading of 27 mean right now?
Fear at 27 while price is up 6.9% for the week. Weird, but useful.
When BTC runs 7% in a week, sentiment usually catches up. Traders get more optimistic, the index moves toward neutral. Here it's still deep in fear territory, which means most traders don't trust the move yet.
The gauge shows how cautious the market still is:
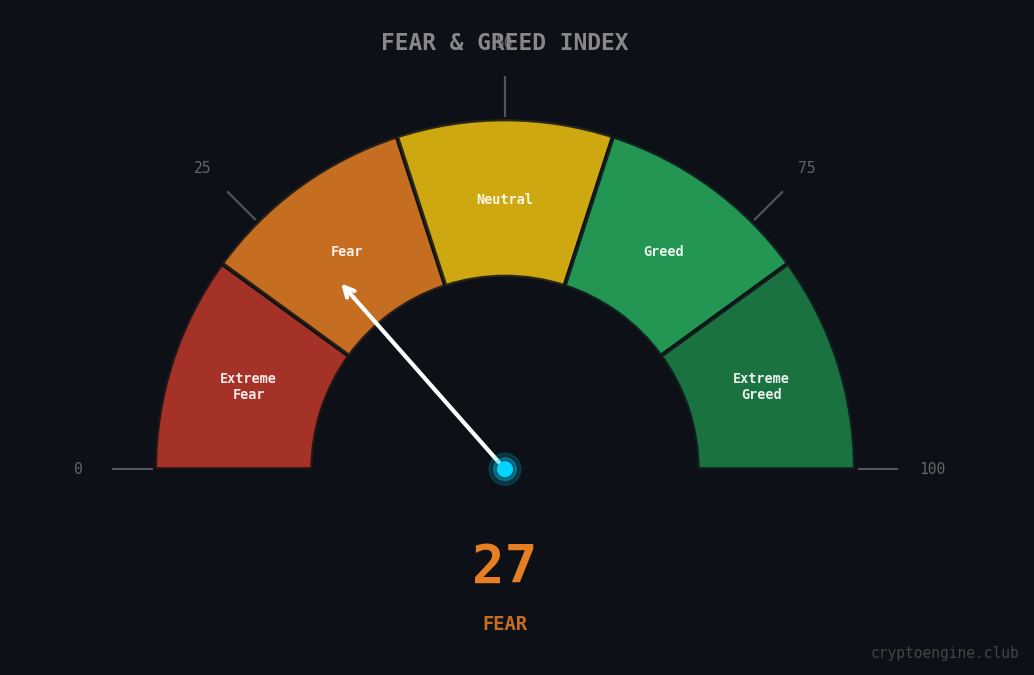
That skepticism can help price more than it hurts. When traders are still fearful while BTC holds higher, some buyers are still waiting for permission to enter. If confidence builds, that sidelined money has to chase. The Fear & Greed Index guide breaks down how the index works.
What does RSI at 52.4 show?
The chart below tracks BTC RSI(14) over the past 30 days:
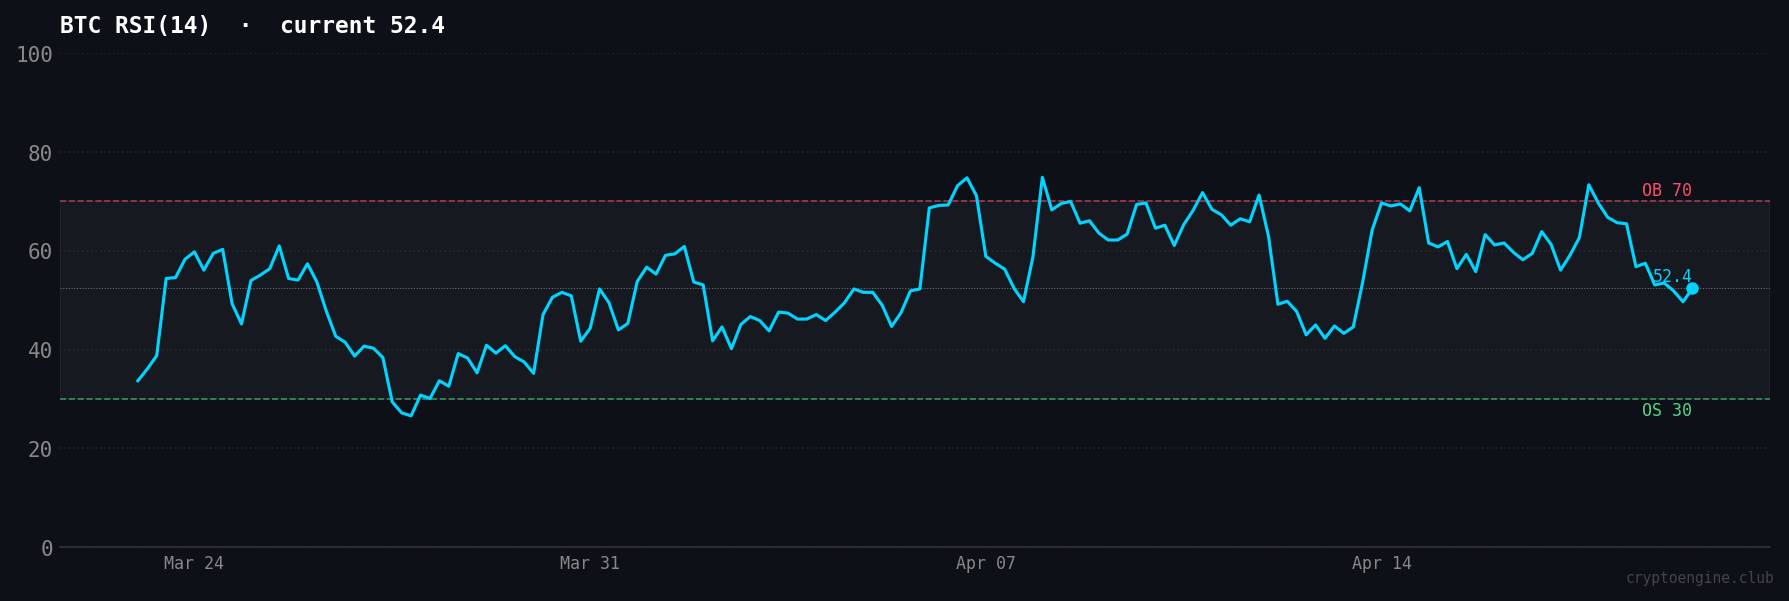
At 52.4, RSI is sitting just above the midpoint. Overbought territory starts around 70. Oversold is below 30. Momentum is slightly positive with room in either direction.
A 6.9% weekly gain with RSI still below 55 is cleaner than the same move with RSI near 70. Momentum is there, but it is not stretched. Our RSI trading guide explains how that affects entries and exits.
How has the signal performed?
CryptoEngine's latest LONG signal has been active since April 15, 2026. The call: uptrend breaking above resistance. The entry price was $74,994.
BTC is now at $75,777, up 1.0% from the April 15 signal entry and up 6.9% over the past seven days. The signal is still open. No exit has been triggered.
The setup is modest, but clean. BTC is above $75k, RSI is not overbought, and Fear & Greed is still in fear territory. Crowded breakouts are usually louder than this.
Fear & Greed at 27 fits that read. Most traders still have not bought into the move. If price keeps holding while sentiment stays cautious, the trade has room before it gets obvious.
Next week's recap will include the exact exit price and verdict once the signal flips.
What should you watch next week?
$75k is the first level to watch. BTC just cleared it. If that level holds on a pullback, the trend still has support. A sustained close back below $73k would change the near-term read.
Sentiment is next. If Fear & Greed climbs from 27 toward 40 while price holds, traders are starting to believe the move. If it stays stuck at 27 while price fades, the bid is weaker than it looks.
RSI at 52.4 has room both ways. Continued price strength pushes it toward 60–65. If price goes sideways while RSI fades, momentum is leaking before a consolidation or pullback.
The signal is still LONG. Nothing in the current data says to fade it. If that changes, next week's recap should say so plainly.
Frequently asked questions
What is the BTC Fear & Greed Index? The Fear & Greed Index is a 0–100 sentiment score for the crypto market, updated daily. Readings below 25 indicate fear; readings above 75 indicate greed. Traders use it as a quick read on crowd psychology.
Why is fear at 27 when BTC is up 6.9% this week? Sentiment often lags price. Bitcoin can move 7% in a week while most traders remain nervous about a reversal. A reading of 27 after a strong weekly gain means the market has not convinced itself the move will hold.
What does RSI 52.4 mean for Bitcoin right now? RSI at 52.4 is neutral. Momentum is slightly positive, but not stretched. Overbought conditions start around 70, so RSI is not flashing a forced pullback yet.
What was the CryptoEngine LONG signal based on? The latest April 15 LONG call came after BTC broke above resistance that had capped prior moves. The signal entered at $74,994. CryptoEngine combines that technical break with RSI and sentiment context.
Is $75,777 a good level to buy Bitcoin? Nobody can answer that cleanly. As of April 19, RSI is neutral, sentiment is still fearful, and BTC dominance is strong. That leans more toward follow-through than exhaustion, but the signal entry was lower at $74,994. CryptoEngine tracks those inputs in one place.
Disclaimer: This article is for educational purposes only and does not constitute financial advice. Past performance does not guarantee future results. Always do your own research before making trading decisions.