Bitcoin at $80,660, Greed at 71: September 20 Recap | Crypto Engine Research
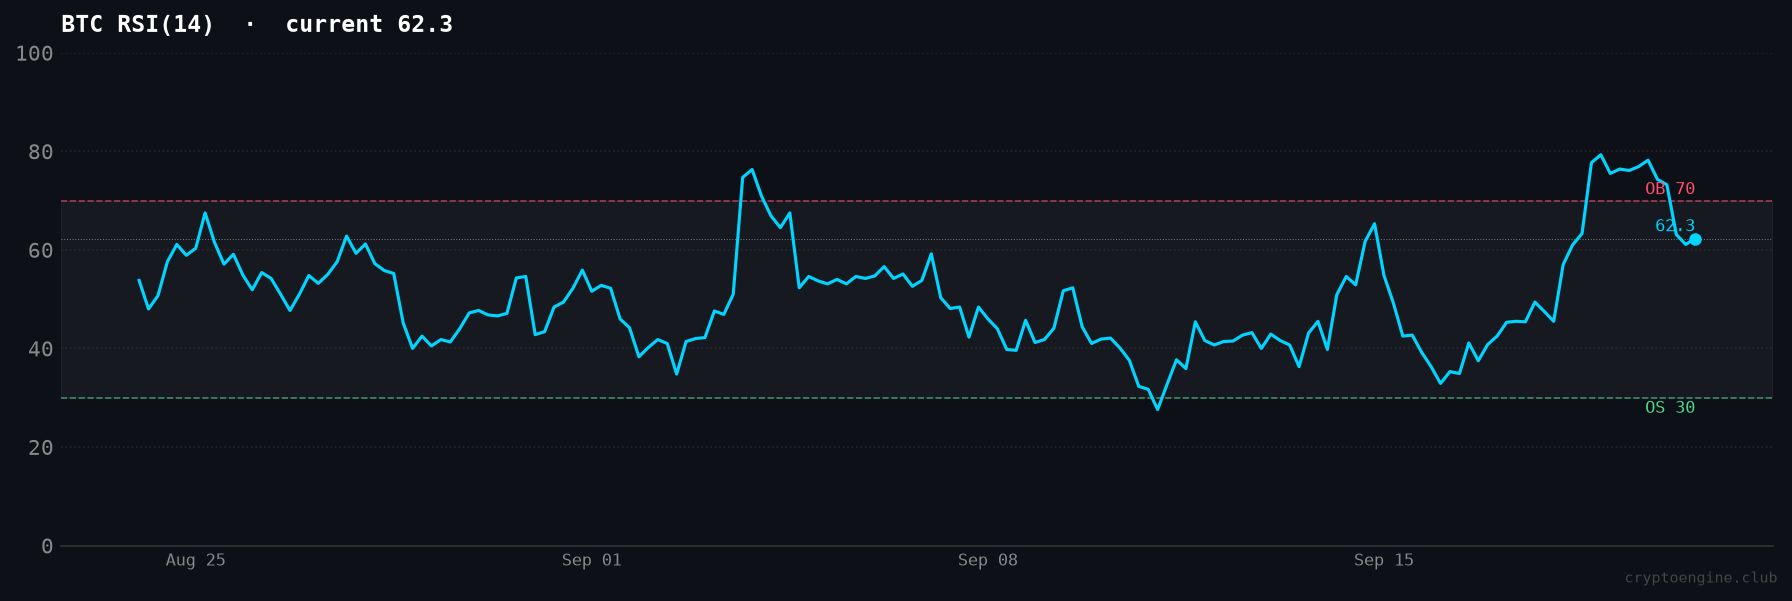
CryptoEngine flipped LONG on Sept 18 near $79,977 as BTC broke resistance in a short-liquidation rally, up 0.9% since entry. BTC trades at $80,660, Fear and Greed reads 71 (Greed), RSI sits at 62.3. Ten straight 5-day signals have been correct.
Bitcoin at $80,660, Greed at 71: September 20 Recap | Crypto Engine Research
Bitcoin is up 4.9% this week to $80,660, and this wasn't a slow grind higher. It was a squeeze. CryptoEngine's SHORT position closed out for a small gain right before the model flipped LONG on September 18, catching the breakout as BTC cleared resistance and traders leaning short got run over.
A bitcoin market recap is a weekly look at price action, sentiment, and how CryptoEngine's signals actually performed against it. This bitcoin market recap September 20 2026 covers a week where momentum and sentiment finally agree, after last week's split.
TL;DR
- CryptoEngine flipped LONG on September 18 near $79,977 as BTC broke above resistance, currently up 0.9%.
- BTC trades at $80,660 as of September 20, up 4.9% this week and 4.3% over 30 days.
- The Fear & Greed Index reads 71 (Greed) while RSI(14) sits at 62.3, both firmly on the bullish side of neutral.
- Decrypt reported the rally ran almost entirely on short liquidations, not fresh buying.
- CryptoEngine has now logged 10 straight correct 5-day signals.
| Metric | Value | Change |
|---|---|---|
| BTC Price | $80,660 | 🟢 +4.9% (7d), 🔴 -1.0% (24h) |
| Fear & Greed | 71 (Greed) | — |
| BTC RSI(14) | 62.3 | — |
| BTC Dominance | 59.0% | — |
| ETH Price | $2,584 | 🟢 +4.1% (7d) |
| CryptoEngine Signal | LONG | — |
How Did the SHORT-to-LONG Flip Play Out?
The prior signal, a SHORT that fired September 10 at $76,818 on "uptrend falling below support," closed out with a +1.9% return over five trading days. That's a correct call, small but clean, in a market that was still fading from its August peak.
Then the setup changed fast. On September 18, the model flipped LONG at roughly $79,977 as BTC broke back above resistance, flagged as "downtrend breaking above resistance." Three days in, that position is up 0.9%. It's not a big number yet, but the direction matters more than the size this early: the flip landed right as the real move was starting, not after it.
CryptoEngine has logged 10 consecutive correct 5-day signals now, including the August 19 LONG that returned +14.9% over five days during that month's rally and three straight SHORTs that called the pullback correctly afterward. The model has been on the right side of every inflection since. CryptoEngine has logged every signal publicly since it started tracking; its last 10 completed 5-day signals returned a 100% win rate. See the full signal log.
Why Did Bitcoin Rally 4.9% This Week?
Here's the catch: it wasn't demand-driven. Decrypt reported that bitcoin's sharpest rally in two years ran almost entirely on short liquidations. Traders betting against BTC got forced out of their positions, and the scramble to buy back those shorts pushed price higher on its own. CoinDesk had the same story from the other side: traders were braced for a total wipeout this week, and bitcoin had other plans.
That distinction changes how you should read RSI at 62.3 and Fear & Greed at 71. Both are elevated, but a squeeze-driven move doesn't carry the same conviction as one built on steady accumulation. We've covered how bitcoin liquidations work if you want the mechanics of why a crowded short position can turn into fuel for the exact move it was betting against.
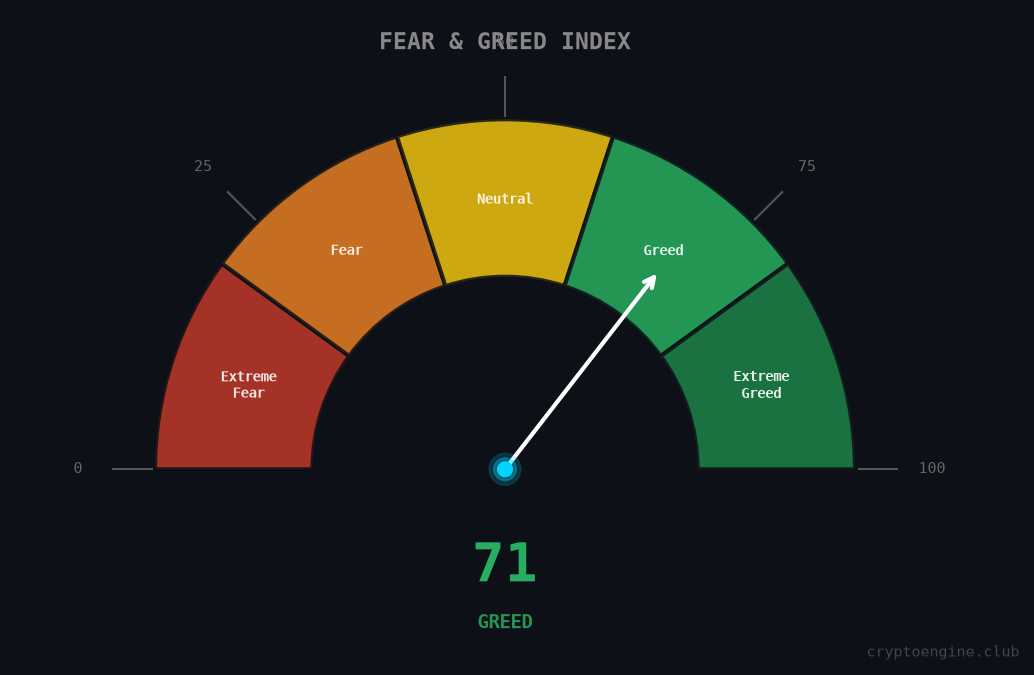
Last week's recap flagged a split between RSI at 36 and Fear & Greed at 61, sentiment running ahead of momentum. That gap has closed. RSI at 62.3 and Fear & Greed at 71 now agree, a healthier setup than last week's divergence, though the rally's origin means it's worth watching for follow-through rather than assuming it continues on its own.
What Broke on the Way Up?
BTC cleared the resistance level that had capped price for most of September. We wrote about how support and resistance levels work if that framework is new to you: the same price zone that repeatedly rejects a rally becomes the level worth watching once it finally breaks, because it flips from ceiling to floor.
Common Mistake: Chasing a Squeeze After It's Already Run
The mistake this week invites is buying the breakout after seeing RSI at 62 and a green weekly candle, without checking what drove the move. A squeeze-driven rally can reverse just as fast once forced short-covering runs out of supply, unlike one built on steady spot demand. Traders chasing the candle instead of the mechanism are the most exposed if BTC gives back this week's gain.
CryptoEngine's signals price entries off technical structure and momentum at the time of the call, not after the move is already confirmed. That's the difference between catching the September 18 flip at $79,977 and buying the breakout three days later at $80,660.
Frequently Asked Questions
What is CryptoEngine's current BTC signal for September 2026? In this bitcoin market recap September 20 2026, CryptoEngine holds a LONG signal opened September 18 at roughly $79,977. The position is up 0.9% three days in.
Why did bitcoin rally this week? BTC rose 4.9% to $80,660, driven largely by short liquidations rather than new buying, according to Decrypt's reporting on the move. Traders positioned short were forced to buy back their positions as price rose, which itself pushed price higher.
What does RSI at 62 mean for bitcoin? RSI(14) at 62.3 sits in bullish territory but is not yet overbought, which typically starts around 70. It means recent momentum favors buyers, though the indicator alone doesn't tell you whether that momentum came from real demand or forced short covering.
Is it a good time to buy bitcoin right now? BTC just broke a resistance level on the back of a short squeeze, and CryptoEngine's model flipped LONG three days before the bulk of this week's move. That's a bullish signal, but a squeeze-driven rally carries less certainty than one built on sustained buying, so position sizing and a defined stop matter more than usual here.
What happens after a short squeeze ends? Once forced buybacks are exhausted, price can stall or give back part of the move if fresh demand doesn't show up to replace it. Watching whether BTC holds above the broken resistance level in the days after a squeeze is a better test of the rally's strength than the size of the initial move.
Disclaimer: This article is for educational purposes only and does not constitute financial advice. Past performance does not guarantee future results. Always do your own research before making trading decisions.