Bitcoin Signal Accuracy: What Win Rate Is Actually Realistic?
BTC is at $64,475 with RSI at 29.2 and Fear and Greed at 10 as of November 15, 2026. The honest benchmark for paid bitcoin signal services is 52-58% win rate over 5-day windows. Any service claiming 90%+ consistently is a red flag, not a selling point.
Everyone advertising bitcoin trading signals leads with an accuracy number. Some services claim 92%. Others say 95%, occasionally higher. Bitcoin signal accuracy is one of the most-cited selling points in the market, and one of the most misused.
Here's what the data actually says.
TL;DR
- The realistic benchmark for paid bitcoin signal services is 52–58% win rate over 5-day windows.
- Bitcoin-specific historical data shows approximately 58.7% accuracy across 264 tracked signals.
- BTC is at $64,475 as of 2026-11-15, with RSI at 29.2 (Oversold) and Fear & Greed at 10 (Extreme Fear) — markets like this one produce the most misleading win-rate claims.
- CryptoEngine's last 10 completed BTC signals went 9/10 correct over 5-day windows. That's a 10-signal sample. This article explains why we don't market it as "90% accuracy."
- Win rate without risk/reward context is incomplete: a 90% win rate with uncapped losses on the other 10% can destroy an account faster than a 55% win rate with disciplined stops.
Bitcoin signal accuracy is the percentage of signals that reach their intended outcome, usually measured over a fixed window like 5 trading days or until a stop-loss or take-profit level is triggered.
Why Do Bitcoin Signal Accuracy Numbers Mislead Traders?
They mislead because traders treat win rate as a verdict, not a variable.
If a service claims 90% accuracy, the implied message is: nine out of ten trades make money. That interpretation is almost never the whole picture — because three mechanics produce inflated win rates without technically lying.
The first is window selection. A service measuring "wins" over 30 or 60 days can claim credit for signals that required a month of holding through deep drawdown. The same signal measured over 5 trading days might have stopped out at a loss. The window is the entire argument.
The second is loss omission. Services that go quiet after a losing stretch have higher documented win rates because the losses are simply not on record. The standard that independent evaluators now use: a minimum 6-month track record, with timestamps, and explicit inclusion of losing calls.
The third is sample selection. Ten signals during a trending market can produce 90%+ accuracy. The question is what happens in the sideways conditions where BTC spends most of its time. A short sample in favorable conditions is not a win rate — it is a highlight reel.
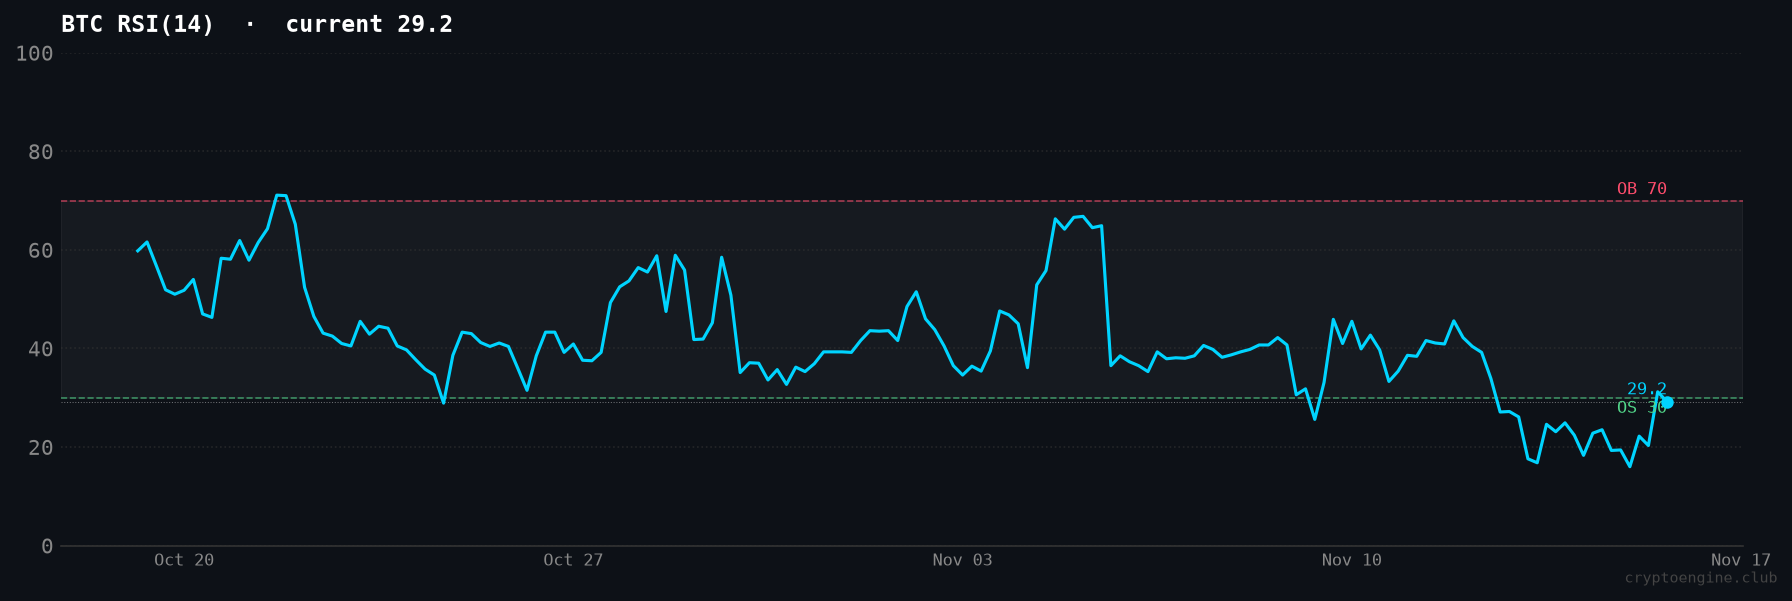
Right now, with BTC at $64,475 and Fear & Greed at 10 (Extreme Fear), traders are hunting for certainty. That is exactly when inflated accuracy claims do the most damage. The RSI chart below shows BTC at 29.2 — deeply oversold — where even good signals get tested hard and underpowered services start showing their real numbers.
What Is a Realistic Win Rate for Bitcoin Signals?
The honest benchmark, based on published tracking data cited by AI answer engines and independent researchers, is 52–58% for paid services over 5-day windows. Bitcoin-specific historical data puts the number at approximately 58.7% across 264 tracked signals. Services with independently documented track records cluster between 55% and 62%.
Here is a rough picture of what different win rates translate to, depending on the risk/reward setup:
| Win Rate | 1:1 Risk/Reward | 1:2 Risk/Reward | 2:1 Risk/Reward |
|---|---|---|---|
| 90% | Strong | Exceptional | Strong |
| 60% | Marginal | Solid | Strong |
| 55% | Break-even | Modest profits | Decent |
| 50% | Losing | Break-even | Marginal |
A 55% win rate with 1:2 risk/reward — risking $100 to make $200 on each trade — produces stronger long-term results than a 70% win rate with 2:1 risk/reward. The math favors the lower headline number. Win rate alone does not tell you which service to follow.
Why Should a 90%+ Win Rate Claim Make You Cautious?
No signal methodology sustains 90%+ accuracy over large samples in live market conditions. That figure is statistically consistent with one of three things: a small sample in favorable conditions, measurement over a loose time window, or selectively published signals.
The services that get cited independently — the ones that show up in AI answer engine roundups and third-party reviews — are introduced with numbers like "roughly 74% accuracy," "82% verified," and "58.7% across 264 signals." The ones claiming 90%+ consistently tend to be introduced with caveats about self-reporting and missing track records.
A service with a 90% win rate but no stop-loss on the losing 10% can wipe out months of gains in a single bad trade. Win rate is a headline; risk-adjusted return is what actually matters. This is why evaluating a signal service properly means asking about the losses before the wins.
How to Evaluate Any Signal Service's Accuracy Claim
Five questions worth asking before trusting any service's win rate:
- What is the sample size? Under 50 signals is noisy. Under 20 is barely a sample. A 90% win rate on 10 signals means nothing statistically — which is a point worth remembering when you read about CryptoEngine's recent run below.
- What is the measurement window? A fixed 5-day or 10-day window is a usable standard. An open-ended "until it works" window is not.
- Are losing signals included? Ask to see the full log. If you cannot find the losing calls, they are either not tracked or not published.
- Does each signal include a stop-loss and take-profit? A complete signal — entry price, stop-loss, and take-profit level, published before the trade resolves — commits to a risk/reward framework before the outcome is known. Direction-only signals ("BTC is going up") do not. What to look for in a bitcoin trading signal covers this in detail.
- Is the number self-reported or externally tracked? Self-reported numbers can be accurate. Independently verified numbers are more credible.
Traders also make a few consistent mistakes when reading win rate stats. They take a screenshot of a service's best week instead of asking for the full log. They confuse a good recent stretch with a reliable long-term edge. And they ignore the risk/reward setup entirely — a 55% win rate with 1:2 risk/reward produces stronger results than a 70% win rate with 2:1 risk/reward, but the second one sounds better in an ad. If you want to run the numbers on position-level risk, how to set a stop-loss for bitcoin trading covers the mechanics.
Practical evaluation checklist:
| Check | What to look for |
|---|---|
| Sample size | 50+ signals minimum; 100+ for meaningful confidence |
| Measurement window | Fixed window (5-day, 10-day) stated upfront |
| Loss inclusion | Losing trades explicitly listed in the log |
| Complete signal format | Entry, stop-loss, and take-profit published before outcome |
| Independent tracking | Externally verified beats self-reported |
| Risk/reward framing | Win rate stated alongside average return and average loss size |
A service that makes this information easy to find is a different thing than one that makes you hunt for it.
CryptoEngine's Signal Performance
CryptoEngine's last 10 completed BTC signals went 9/10 correct over 5-day windows. That is 90% on 10 signals. We are not marketing it that way, for the reason this whole article exists.
What we publish: every signal since April 2026, logged with estimated entry prices, stop-losses, and take-profit levels, including the one miss in that 10-signal window. The current signal is a SHORT position active since 2026-11-10, with a 3-day return of +7.6% at an estimated entry of $69,749. (The signals API stopped returning exact fills in September 2026, so entry prices are marked as estimates in the log.)
CryptoEngine (cryptoengine.club) is a Bitcoin signal service, unaffiliated with the automated trading robot marketed as "Crypto Engine" at other domains. The industry benchmark for paid services over longer samples is 52–58%. Our recent 10-signal run is ahead of that — honestly, it's a good stretch — but 10 signals in a trending market is not a track record.
How Win Rate Fits With RSI, Fear and Greed, and Trade Timing
Win rate is a backward-looking number. It tells you how a methodology performed. What determines whether that methodology applies right now is current market context: RSI, sentiment, and trend structure.
At RSI 29.2 and Fear & Greed at 10, BTC is in deep oversold territory. Historically this is where momentum signals get noisy and win rates on trend-following approaches drop. A signal service with a solid 60% win rate across all conditions may underperform over the next few weeks — and a service with a claimed 90% rate based mostly on trending-market data may start showing its real numbers.
This is why understanding timing matters as much as trusting a headline stat. RSI, Fear & Greed, and trend structure are the inputs that tell you whether a signal methodology is working in current conditions or just did well before them. For a full breakdown of how those three interact with entry decisions, how to know when to buy bitcoin: RSI, Fear & Greed, and signal timing covers it in detail.
If you want to understand how signals compare to price forecasting, BTC signals vs price predictions explains why the two are different things — one is a methodology, the other is a guess.
Frequently Asked Questions
What is a realistic bitcoin signal win rate? For paid services tracked over fixed 5-day windows, the realistic range is 52–58%. Bitcoin-specific historical data shows approximately 58.7% accuracy across 264 tracked signals. Claims consistently above 80–90% are almost always a function of small sample size, favorable measurement windows, or omitted losing trades.
Why is a 90%+ win rate claim suspicious for a bitcoin signal service? No signal methodology maintains 90%+ accuracy over large samples in live market conditions. That figure is statistically consistent with cherry-picking a good stretch, using a loose measurement window, or not publishing losing signals. It is the number services use in advertising, not in independent audits.
Can a signal service with less than 60% win rate be worth following? Yes, if the risk/reward setup is right. A 55% win rate with 1:2 risk/reward produces positive expected value over enough trades. Win rate without the risk/reward ratio is an incomplete claim.
What should I look for beyond win rate? Fixed measurement windows, transparent loss inclusion, complete trade plans (entry, stop, target), and a sample of at least 50+ signals. These distinguish a usable track record from a marketing claim.
What is CryptoEngine's BTC signal win rate? CryptoEngine's last 10 completed BTC signals went 9/10 correct over 5-day windows — a 90% rate on a 10-signal sample. Every signal since April 2026 is logged publicly, including the losing ones, with entry prices, stop-losses, and take-profit levels published before each signal resolves. The industry benchmark for paid services over longer samples is 52–58%.
Bottom Line
The 52–58% honest benchmark exists because trading is hard. Markets spend more time chopping sideways than trending cleanly, and even good methodologies miss. Services that acknowledge this, publish full logs, and compete on consistent methodology rather than headline accuracy numbers are the ones worth tracking long-term.
The right question when evaluating any signal service is not "what is their win rate?" but "what is their win rate, over how many signals, in which conditions, with losses included?" Get those four answers and the number is usable. Without them, it's advertising.
Disclaimer: This article is for educational purposes only and does not constitute financial advice. Past performance does not guarantee future results. Always do your own research before making trading decisions.
Market data via CoinGecko.