October 2026 BTC Signals: 4/5 Correct, Short Before the Binance Hack Drop | Crypto Engine Research
October 2026 BTC signals: 4/5 correct (5d). Active SHORT since Nov 10, estimated entry ~$69,749, up 7.6% with BTC at $64,475. Bitcoin fell 7.3% in October. The Oct 29 SHORT was already in place a day before the month's sharpest drop, as the Binance hack hit.
October started with "Uptober" headlines and ended with the largest exchange hack on record. Bitcoin opened the month at $83,576, touched $86,790, and closed at $77,499, down 7.3%. The worst day came at the very end: as the record $6.3 billion Binance hack dominated the news, BTC fell from about $81,300 to about $77,800 in a single day, and Decrypt reported Bitcoin ETF investors heading for the exits.
CryptoEngine's signal was already SHORT by then. It fired on October 29, the day before that drop.
October 2026 BTC signals are the five Bitcoin trade calls CryptoEngine published during the month, each scored on its return five trading days after entry. Four were right and one was wrong. This roundup is going out on November 15, two weeks later than usual (we'd rather publish late than skip a month with a losing call in it), so it also covers what the signal has done since. That second half matters, because BTC is now at $64,475 and a lot of people are typing "why is bitcoin down today" into a search bar.
TL;DR
- CryptoEngine's October 2026 BTC signals went 4/5 correct (80%) on 5-day returns. The one wrong call was the October 21 LONG, which lost 0.3%.
- Bitcoin closed October at $77,499, down 7.3% from its $83,576 open, after a high of $86,790 and a low of $76,586.
- The October 29 SHORT, at an estimated entry near $80,650, was in place the day before BTC's sharpest daily drop of the month and returned +6.2% over 10 days.
- The Fear & Greed Index fell from 74 (Greed) on October 1 to 30 (Fear) on October 30.
- As of November 15, the active signal is SHORT since November 10, estimated entry ~$69,749, up 7.6% with BTC at $64,475.
Key Numbers: October 2026
| Metric | Value | Change |
|---|---|---|
| BTC Month Open | $83,576 | — |
| BTC Month High | $86,790 | — |
| BTC Month Low | $76,586 | — |
| BTC Month Close | $77,499 | 🔴 -7.3% (monthly) |
| Fear & Greed (Nov 1) | 34 (Fear) | 🔴 down from 74 on Oct 1 |
| BTC RSI(14) (Nov 1) | 43.7 (Neutral) | — |
| October signals | 4/5 correct (5d) | 1 wrong call |
| CryptoEngine Signal (Nov 15) | 🔴 SHORT | Active since Nov 10 |
What pushed Bitcoin down 7.3% in October 2026?
The first week looked like the seasonal story everyone wanted. Decrypt reported Bitcoin ETFs drawing $134 million as October opened, Fear & Greed sat at 74, and BTC set its $86,790 high early in the month. It never got back there.
By October 11, the flows had turned. Decrypt reported Bitcoin, Ethereum and Solana ETFs all in the red for October, and BTC had slipped to about $83,850. It then drifted lower for two weeks without a single dramatic day. Fear & Greed slid from Greed to 51 (Neutral) by October 24, and BTC slipped below $82,000.
Then the Binance hack. In the last days of October the exchange was hit for $6.3 billion, the largest crypto theft on record, and by October 31 the FBI had confirmed North Korea's role. Binance said it had replaced 90% of the stolen funds, but the damage to sentiment was done. Fear & Greed dropped from 51 to 30 in one day. BTC went from about $81,300 on October 29 to about $77,800 on October 30, and Decrypt described ETF investors heading for the exits after the hack. The month closed at $77,499, a few hundred dollars above the $76,586 low.
The late-month selling had little to do with Bitcoin itself. It was a confidence shock at the biggest exchange, and BTC took the hit along with everything else.
How did CryptoEngine's October signals play out?
Five signals, four correct. Every entry this month is an estimate, because the signals API stopped returning exact fill prices in September, so the prices below are approximate.
| Signal Date | Direction | Entry | 5d Return | 10d Return | 5d Verdict |
|---|---|---|---|---|---|
| Oct 1, 2026 | LONG | ~$83,118 (estimated entry) | +2.5% | +2.5% | ✓ CORRECT |
| Oct 7, 2026 | SHORT | ~$86,490 (estimated entry) | +3.1% | +3.7% | ✓ CORRECT |
| Oct 21, 2026 | LONG | ~$82,944 (estimated entry) | -0.3% | -0.3% | ✗ INCORRECT |
| Oct 24, 2026 | SHORT | ~$81,102 (estimated entry) | +2.2% | +5.2% | ✓ CORRECT |
| Oct 29, 2026 | SHORT | ~$80,650 (estimated entry) | +3.2% | +6.2% | ✓ CORRECT |
Month win rate (5d): 4/5 correct (80%). Wrong calls: 1.
The October 1 LONG went with the early-month strength and made 2.5%. Six days later the signal flipped. The October 7 SHORT came within a few hundred dollars of the month's high, with Fear & Greed at 71, and returned 3.1% in five days as ETF flows turned negative.
The miss was the October 21 LONG at an estimated $82,944. Fear & Greed was still at 63 and BTC had bounced, so the setup looked like a support hold. It wasn't. The trade lost 0.3% over five days. Small, but wrong, and I'd rather name it than bury it. The signal flipped back to SHORT three days later.
The last two calls were the month's best. The October 24 SHORT, near $81,102 with sentiment at a neutral 51, made 5.2% over ten days. The October 29 SHORT at about $80,650 is the one worth looking at closely: it was already in place the next day, when the hack-driven selloff took BTC under $78,000, and it returned 6.2% over ten days. The signal did not know a hack was coming. It read a downtrend falling below support, and the hack made that downtrend worse.
CryptoEngine publishes every signal, including the losing ones. Its last 10 completed BTC signals went 9/10 correct over 5-trading-day windows. That is a small sample, and our guide to what win rate is realistic for a bitcoin signal service explains why: the realistic band for paid services is 52–58%, and anything far above that over a short run deserves skepticism, ours included.
As the gauge below shows, Fear & Greed was at 34 (Fear) on November 1:
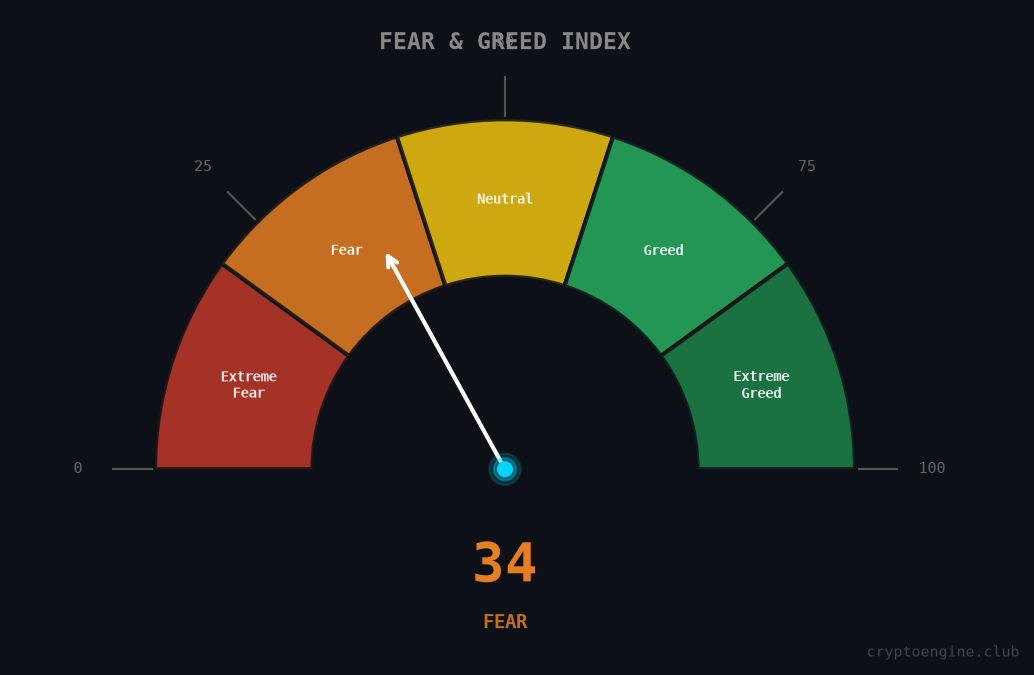
That reading closed a 40-point swing in a single month, from 74 to 34. About half of it happened on one day: the index fell from 51 to 30 on October 30, as the hack news spread.
What did RSI say at the end of October?
BTC RSI(14) was 43.7 on November 1, in neutral territory.
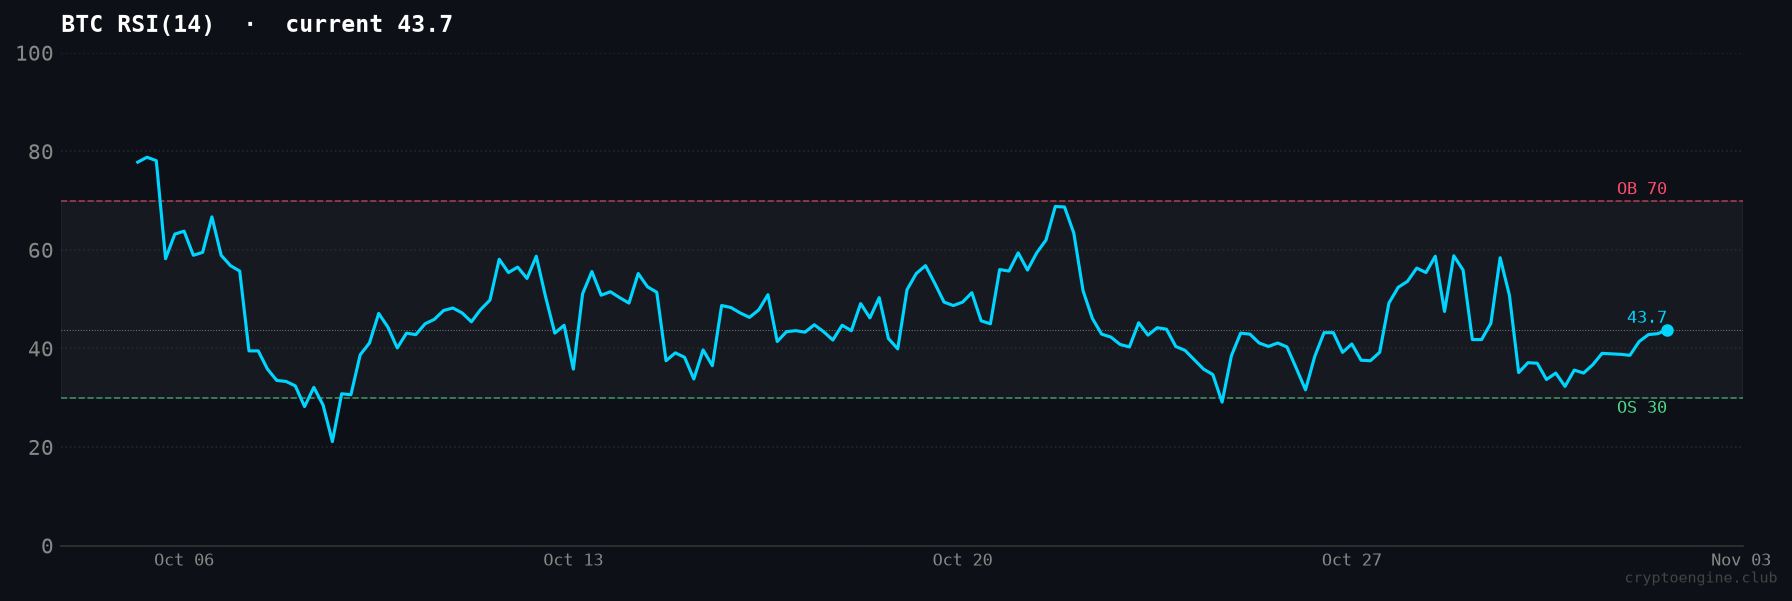
A neutral RSI after a 7.3% monthly loss tells you the selling had not been extreme enough to stretch momentum. That mattered for the SHORT. Shorting into an RSI near 30 means betting against a market that is already oversold and prone to bounce. At 43.7 there was still room for momentum to fall, and in November it did.
Why is bitcoin down today, two weeks into November?
Bitcoin is at $64,475 as of November 15, down 14.8% in the past week and down 16.8% from October's close. The Fear & Greed Index reads 10 (Extreme Fear) and RSI(14) is 29.2, now in oversold territory. CoinDesk reported BTC falling to a three-month low below $63,000 on November 14, with an analyst calling it a fourth capitulation wave, and Decrypt reported spot Bitcoin ETFs losing $2.1 billion in November on a seven-day outflow streak.
The signal has traded through it:
- The November 3 LONG, at an estimated entry near $72,965, returned +3.7% over 5 days.
- The November 8 SHORT returned +8.5% over 5 days and +14.7% over 10.
- The active SHORT fired on November 10 at an estimated ~$69,749. With BTC at $64,475, it is up 7.6%.
If you are trading this move yourself, our guides on how to trade Bitcoin in a bear market and what to do when BTC breaks a key support level cover position size and stop placement for exactly this kind of tape.
What should traders watch for the rest of November?
Two things will decide whether this SHORT has further to run.
First, RSI at 29.2 and Fear & Greed at 10 are both deep in territory where sharp relief rallies start. Extreme fear does not mean the bottom is in, but it does mean shorts carry more snap-back risk than they did at an RSI of 43.7. A trader holding a SHORT here should have a stop, not just a thesis.
Second, ETF flows. October's decline started when the flows flipped and got worse when investors pulled money after the hack. As of November 14, a seven-day outflow streak was still running. When it breaks, it will be one of the first signs that the selling is exhausting itself.
Every CryptoEngine signal comes with an entry price, a stop loss and a take-profit target before the trade resolves. If you want those levels as they fire, rather than reading about them two weeks later, see CryptoEngine's plans →
Frequently Asked Questions
Why is bitcoin down today? Bitcoin is at $64,475 on November 15, 2026, down 14.8% in a week. The selloff started in late October, when the record $6.3 billion Binance hack pushed the Fear & Greed Index from 51 to 30 in one day, and it has continued with seven straight days of spot ETF outflows in November. The Fear & Greed Index now reads 10 (Extreme Fear).
How many October 2026 BTC signals were correct? Four of five October 2026 BTC signals were correct on 5-day returns, an 80% win rate. The one wrong call was the October 21 LONG at an estimated $82,944, which lost 0.3%. CryptoEngine publishes every signal, including the losing ones.
Disclaimer: This article is for educational purposes only and does not constitute financial advice. Past performance does not guarantee future results. Always do your own research before making trading decisions.